Author: Brian Rudick, Senior Strategist
We provide a brief review of technical analysis for cryptocurrency trading in this week’s Chart of the Week.
- Technical Analysis Overview: Technical analysis is a method used to identify trading opportunities by looking for patterns and trends in historical market data such as price and volume. In contrast to fundamental analysis, which examines company, industry, and macroeconomic factors to generate reports regarding the future, technical analysis relies on mathematical heuristics or pattern-based signals to predict possible price movements. Technical analysis uses reports from market psychology, behavioral economics, and quantitative analysis, believing that price movements give clues about market sentiment and human psychology follows consistent patterns. Traders often combine multiple techniques and may consider outside qualitative factors to improve decision making and add further confidence. The time frame chosen for the analysis depends on the trading strategy, though technical analysis in general is typically employed for more shorter-term trading, especially compared to fundamental analysis that is often used for longer-term investing.
- Technical Analysis Types: There are many segments of technical analysis, but often involve looking at market statistics like volumes, chart patterns like support and resistance levels, and technical indicators like the relative strength index. Examples include:
-
- Candlestick Charts: A candlestick chart is a style of financial chart used to describe price movements, with each candlestick summarizing the movement over a selected time interval. Candles have a thick middle part called the body, where green candles indicate the price increased during that time interval and as such, the bottom of the body is the opening price and the top is the closing price. Red candles indicate that the price fell during the period, so the top of the body is the open price and the bottom the closing price. Candles also have lines called wicks extending from the top and bottom of the body showing the maximum and minimum price during the time interval. Volume, which is often shown at the bottom of a candlestick chart, is considered as an indicator of the strength of the trend, with stronger trends accompanied by higher volumes and vice versa.
-
- Candlestick Patterns: Candlestick patterns are formations of candlesticks in a specific way that may help predict price direction. Traders seek to identify various formations in one or two candlesticks such as hammer, engulfing, and close above/below candles. For example, in a hammer candlestick pattern, a long wick on the bottom of a candle means traders are buying the dip, since the price went quite low but there was strong enough demand to push the price all the way back up close to the open price, and this is seen as bullish. The opposite happens with a long wick on the top of a candle, which often signifies that traders are taking profits. Candlestick patterns may be used to help identify potential reversals, market sentiment, or entry points for trades.
-
- Uptrends and Downtrends: Traders often try to identify trending markets, which are generally easier to trade than to try to pick out reversals. An uptrend is when a market is making higher highs and higher lows. Trends are measured relative to their prior highs or lows so, for example, in an uptrend, as long as a pullback doesn’t go below the prior pullback, the trend is considered to still be intact. Downtrends are characterized by the opposite – lower highs and lower lows.
-
- Support and Resistance: Support and resistance levels are where the price may pause or reverse the prevailing trend. Support is the level where a downtrend may pause due to a concentration of demand, while resistance is the level where an uptrend may pause due to a concentration of supply. If the price is in an uptrend, the prior level of resistance that was broken becomes the support, while in a downtrend, the prior level of support that was broken becomes the resistance. Support and resistance levels are useful to spot possible reversals, entry points on trend continuation trades, and to determine stops and targets.
-
- Moving Averages: Moving averages take the average price over a specific period of time, and smooth out price trends by filtering out noise from short-term price fluctuations. For example, a 20 period moving average takes the closing prices of the last 20 candles and divides by 20 before plotting that line on the price chart. Traders often use moving averages to help define trends (eg. uptrends are when the price is trading above a moving average line), to help define areas of value (eg. buy when a trending price gets close to the moving average line, especially if confirmed by other indicators), and as a trailing stop loss to improve the reward to risk ratio. Traders often look at 20, 50, and 200 day moving averages and frequently compare multiple moving average trendlines with one another. For example, a golden cross is when a shorter-term moving average trendline crosses above a longer-term moving average trendline and is bullish, while the opposite is termed a death cross and is bearish. Traders may also examine exponential moving averages as well, which place more weight on recent prices and thus react faster to price changes. Lastly, moving averages form the basis for the popular MACD indicator.
-
- Chart Patterns: Unlike candlestick patterns that look at just one or two candlesticks, chart patterns examine many candles, typically 10 to 50, and look for identifiable patterns that may hint at future price movements. Like candlestick patterns, chart patterns can give indications of possible reversals, market sentiment, and trade entry points. There are hundreds of chart patterns, though triangles, flags, wedges, double bottoms/double tops, and head and shoulders are some of the more popular ones.
-
- Average True Range: The average true range (ATR) indicator gives the average movement of price over the last 14 candles, and is simply the total price movement over that period divided by 14. ATR helps traders stay in line with the price volatility of the timeframe being examined, helping to give the trade breathing room and keep from getting “wicked out.” Traders may form different strategies, such as setting a stop loss one ATR above or below support or resistance levels while setting the target two ATRs above or below the current price.
-
- Relative Strength Index: The relative strength index (RSI) is a momentum indicator measuring the magnitude of recent price changes and tells traders when price has been moving in a certain direction for a long period of time. When RSI is above 70, the asset is said to be overbought, while an RSI below 30 is said to be oversold. In addition to RSI, other popular tools include Bollinger Bands and Fibonacci.
Exhibit 1: BTC/USD Candlestick Chart and Technical Analysis Summary
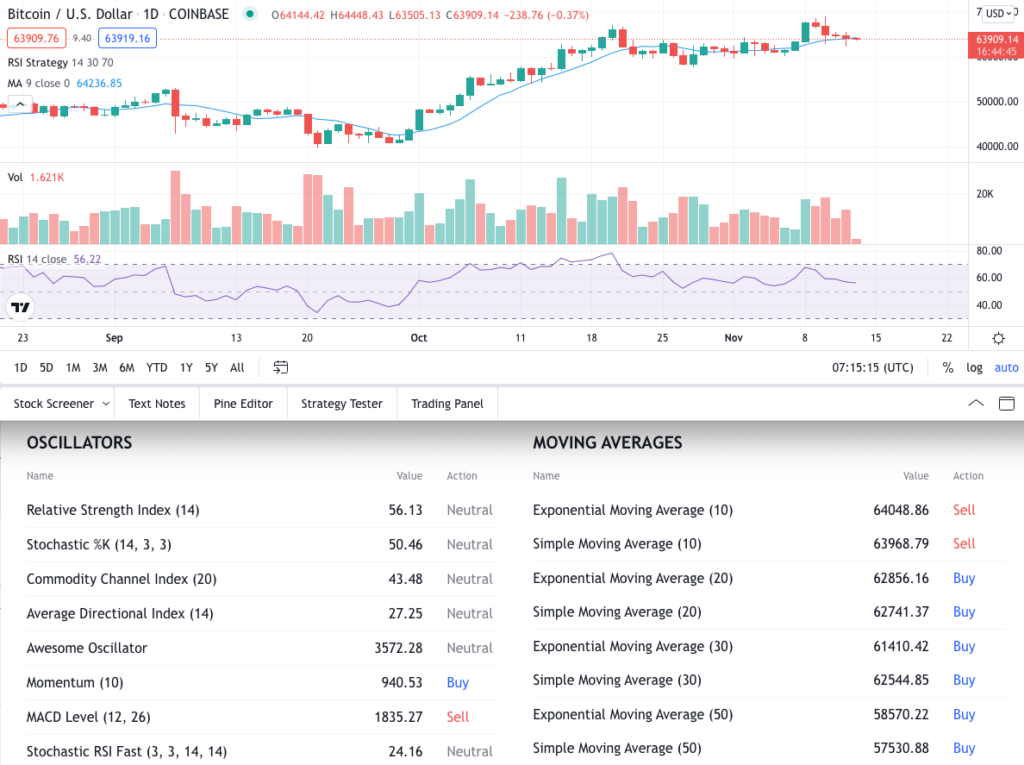
Source:TradingView, GSR
To download this article as a PDF, click here.
Sources
Gemini: Technical Analysis and Crypto
The Trading Channel: The Only Technical Analysis Video You Will Ever Need
Investopedia: Guide to Technical Analysis
Coin Bureau: Technical Analysis: Everything You Need to Know
This material is a product of the GSR Sales and Trading Department. It is not a product of a Research Department, not a research report, and not subject to all of the independence and disclosure standards applicable to research reports prepared pursuant to FINRA or CFTC research rules. This material is not independent of the Firm’s proprietary interests, which may conflict with your interests. The Firm trades instruments discussed in this material for its own account. The author may have consulted with the Firm’s traders and other personnel, who may have already traded based on the views expressed in this material, may trade contrary to the views expressed in this material, and may have positions in other instruments discussed herein. This material is intended only for institutional investors. Solely for purposes of the CFTC’s rules and to the extent this material discusses derivatives, this material is a solicitation for entering into a derivatives transaction and should not be considered to be a derivatives research report. This material is provided solely for informational purposes, is intended for your use only and does not constitute an offer or commitment, a solicitation of an offer or comment (except as noted for CFTC purposes), or any advice or recommendation, to enter into or conclude any transaction (whether on the indicative terms shown or otherwise), or to provide investment services in any state or country where such an offer or solicitation or provision would be illegal. Information is based on sources considered to be reliable, but not guaranteed to be accurate or complete. Any opinions or estimates expressed herein reflect a judgment made as of the date of publication, and are subject to change without notice. Trading and investing in digital assets involves significant risks including price volatility and illiquidity and may not be suitable for all investors. GSR will not be liable whatsoever for any direct or consequential loss arising from the use of this Information. Copyright of this Information belongs to GSR. Neither this Information nor any copy thereof may be taken or rented or redistributed, directly or indirectly, without prior written permission of GSR. Not a solicitation to U.S. Entities or individuals for securities in any form. If you are such an entity, you must close this page.