
After covering the role of miners and the inputs they use to bring bitcoin to fruition in prior reports, we discuss the bitcoin mining business model, explore value drivers, and profile several public miners in the latest edition of our bitcoin mining-focused multi-part Chart of the Week.
The Bitcoin Mining Business Model
The bitcoin mining business model is a strong one, allowing for bitcoin mining companies to create bitcoin at structurally lower prices than the market and achieve high-profit margins when the price of bitcoin is high. Indeed, given economies of scale in procurement and operations, many top public miners have a marginal cost of production well below $10,000 per bitcoin, leading to ~80% gross profit margins for their self-mining businesses even after the recent dip in bitcoin price. Moreover, though less certain, there are opportunities for outsized growth, whether from individual miners taking hash rate market share or from bitcoin’s price outpacing the decrease in issuance from block reward halvings. These key attributes lead to what has and may continue to be a business model displaying strong profitability and growth.
Notwithstanding these positives, miners face a unique set of challenges. First, miners must deal with unpredictable inputs, where future mining profits are determined by volatile, unpredictable, and uncontrollable items like the future price of bitcoin, the future network hashrate, and the future price and speed/efficiency of rigs. Further, barriers to entry are low in normal times and bitcoin miners must increase their hashrate commensurate with that of the network or see their number of bitcoin mined drop. This in tandem with the industry’s high margins has led to a hashrate arms race despite an inability to know the “correct” strategy ex-ante. Lastly, given the nascency of the industry, bitcoin miners generally have inefficient capital structures funded mostly with equity. These challenges have led to an industry characterized by high earnings volatility, poor earnings visibility, and a high cost of capital resulting in low valuation multiples.
In the next few sections, we dig into the income statement and discuss the drivers of revenue, expenses, and profitability before diving into competitive strategies, profiling several top miners, and digging into the valuation.
Bitcoin Mining Revenues
Bitcoin miner revenues are determined mainly by the number of bitcoin mined and the price of bitcoin at the time of mining (Revenue =number of bitcoin mined * price of BTC). Further and as covered previously, a new block is produced roughly every ten minutes and the current block reward is 6.25 bitcoin, equating to nearly 330,000 bitcoin mined each year by the industry or 900 bitcoin per day. As miners join mining pools to smooth out production and the impact of luck, the expected number of bitcoin mined by any individual miner will be proportional to that miner’s hashrate market share. As such, we can further break out the number of bitcoin mined as a company’s hashrate market share applied to total industry bitcoin production. For example, a miner with a 4.0 EH/s total hashrate when the network hashrate is 200 EH/s will have a 2.0% hashrate market share and thus will garner 2.0% of the 900 bitcoin produced daily. This equates to 18 bitcoin each day, and should the price of bitcoin be $40,000 on that day, the miner would be expected to generate $720,000 of revenue. Note that in practice, miners may underperform this theoretical production calculation, either because rigs were offline or added late in the measurement period. Nevertheless, in more detail and including transaction fees, annual bitcoin mining revenue can be described as:
Revenue = (company hashrate/network hashrate) * 52,560 blocks/year * [6.25 block reward + tsx fees] * price of BTC
In addition to self-mining, many vertically integrated miners will offer hosting services, where they host and operate rigs owned by another party in exchange for a fee. Such fees typically incorporate minimum power usage and may be charged as a spread over the hosting provider’s direct power costs or contain a profit-sharing component. Hosting diversifies revenue, provides a source of fiat revenue helping miners HODL, and is steadier relative to self-mining, which may lower a miner’s cost of capital if it is a large enough part of their business. However, hosting is less profitable than self-mining in good times, and as such, many miners who provide hosting services constantly evaluate this tradeoff, more heavily weighting whichever business provides the highest expected return on capital at the time.
In addition to self-mining and hosting revenues, many miners may generate ancillary revenues, both operating and nonoperating, from various other sources. These include realized gains/losses on sales of digital assets, equipment sales, construction and engineering revenue, and interest earned on lending out their HODL, to name a few. We show the revenue breakout for five top publicly traded miners below. Note that Core Scientific’s other revenue comes from equipment sales, where the company leverages its relationship with leading manufacturers to secure equipment in advance and then sells the equipment to its customers.
Exhibit 1: Miner Revenue Composition, 2021
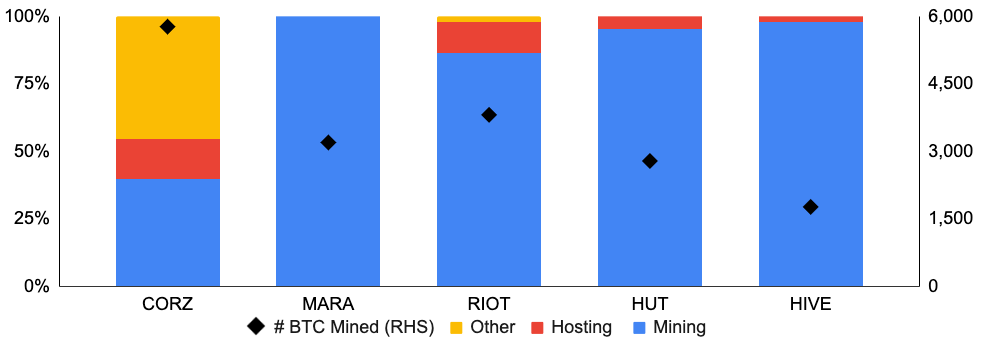
Source: Company websites, GSR
With self-mining (ie. mining for oneself, rather than as part of a hosting business) representing the vast majority of revenue for most miners, miners are under constant pressure to grow their hashrate market share and capture an ever-increasing number of the 900 bitcoin mined by the industry each day. This has led to an increasing network hashrate, especially after last year’s strong profitability and high availability of capital. In fact, most industry estimates place the Bitcoin network hashrate rising from ~220 EH/s currently to over 300 EH/s by year-end. BitOoda, for example, predicts a year-end 2022 network hashrate of 327 EH/s, with power infrastructure currently the gating factor to miner expansion, but semiconductor availability the limiter later in the year.
Such industry hashrate estimates tend to be fairly accurate over the near-term, as analysts can simply perform a bottoms-up analysis by looking at public company disclosed rig orders and estimate non-publicized orders and potential time delays, or perform a top-down analysis by estimating global chip production and the percentage going to crypto mining. Over a longer period of time where the price of bitcoin has more room to move higher or lower, however, such estimates may prove less accurate as the resulting profitability will have a large impact on the network hashrate. More specifically, strong profitability will attract greater investment in hashrate causing it to rise, while lower profitability will not only cause investment in hashrate to fall but also miners to turn off their unprofitable rigs. Note that the system has some balancing characteristics, where a falling bitcoin price isn’t as bad as it’d be in isolation for low-cost producers as some of the network hashrate moves offline (ie. a remaining miner will produce bitcoin at a lower price, but this is partially offset by the miner producing more bitcoin given the lower network hashrate). Conversely, a rising bitcoin price will undoubtedly attract additional hashrate and dampen the positive price impact for a specific miner if their hashrate market share fails to keep pace.
Exhibit 2: BitOoda Network Hashrate Projection, EH/s, Log Scale
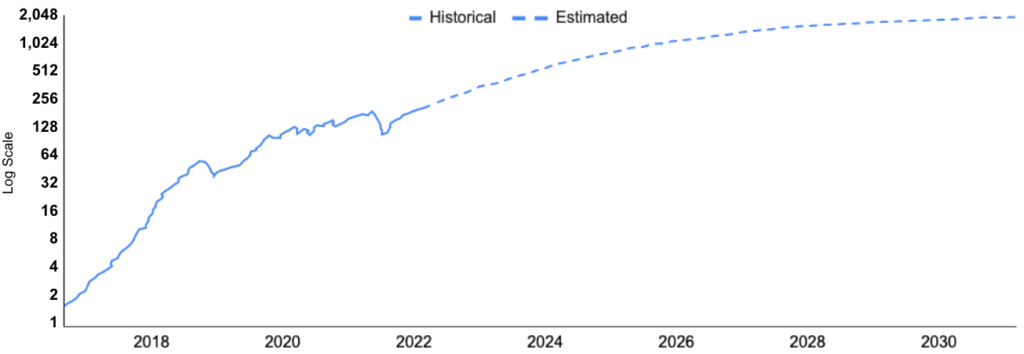
Source: BitOoda, GSR
With revenues proportional to hashrate market share and abundant capital after last year’s exceptional financial results, many of the largest miners are materially increasing efforts to expand. Marathon Digital, for example, is guiding for its 3.9 EH/s hashrate as of March to increase to 23.3 EH/s by early 2023. This should increase its network hashrate market share from 2.0% to ~7% using BitOoda’s year-end network hashrate estimate should the company achieve its guidance. Core Scientific and Riot Blockchain are also guiding to large increases in their self-mining hashrate, amounting to roughly two percentage point increases in each of their hashrate market shares, or an extra 18 bitcoin produced per day at year-end compared to March. As we’ll see later on, however, buying as many of the newest rigs at current prices may not produce the optimal outcome, and the current hashrate is more valuable than the future hashrate not yet in. Nevertheless, the five public miners highlighted below are guiding for their current cumulative 11.2% hashrate market share to nearly double by year-end.
Exhibit 3: Year-End 2022 Guided Hashrate (EH/s) and Hashrate Market Share
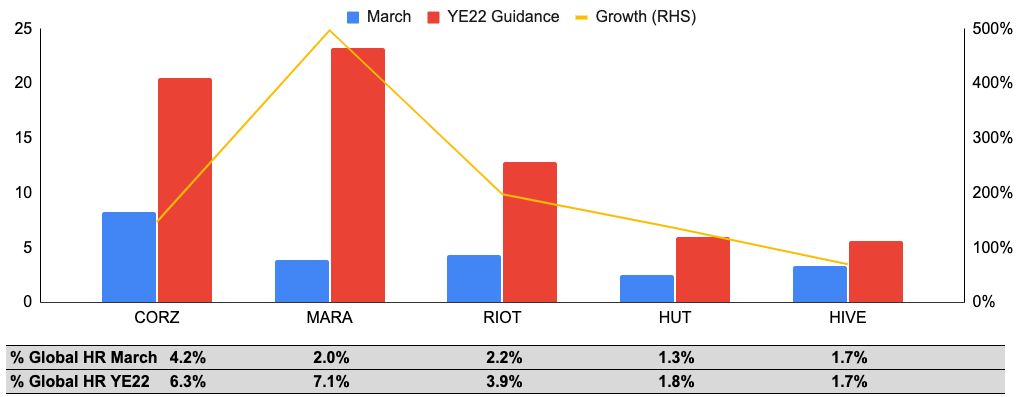
Source: Company websites, GSR
Note: Hashrate denotes a miner’s hashrate used for self-mining and it excludes any hashrate that they may host for other miners. Hashrate numbers are shown in bitcoin-equivalent terms and may represent a mix of BTC/ETH hashrate. Current hashrate numbers are as of March 2022. Future hashrate targets are management guidance for year-end 2022, except for Marathon and Riot, which are guidance for Q1 2023 and Jan 2023, respectively. Uses BitOoda’s year-end 2022 network hashrate forecast of 327 EH/s published on April 4, 2022.
Bitcoin Mining Expenses
To generate revenue, miners combine power, rigs, and hosting sites, all of which come with their own costs. In more detail, major expenses for bitcoin mining companies include:
- Power: Power is the most important input into bitcoin mining as electricity costs comprise the vast majority of a miner’s marginal cost of production. In addition, inexpensive power allows for exceptional gross margins when the price of bitcoin is high (90%+ late last year) and for rigs to profitably remain online when the price of bitcoin falls. Miners who own their own facilities tend to enter into long-term power purchase agreements with grid operators and commit to purchasing a fixed amount of power over a long period of time, such as five or more years. Large miners with access to the cheapest power can procure electricity costs in the $0.02-0.03 per kWh range. To demonstrate just how inexpensive these prices are for the top miners, the average electricity price for households per kWh as of September 2021 was $0.34 in Germany, $0.28 in the UK, $0.24 in Japan, $0.16 in the US, $0.09 in China, and $0.08 in India. Alternatively, miners that use hosting services pay for electricity and hosting costs together, with Marathon’s $0.0426 per kWh blended cost across its entire fleet as an example.
- Rigs: Rigs are generally ordered in bulk, often at discounts up to 50% compared to what an individual would pay for a single rig. That said, rig prices can fluctuate greatly with the price of bitcoin, increasing 4x or more during bull runs. Rigs are an asset on the balance sheet and depreciated using the straight-line method over their expected useful lives. While new rigs may last for five to seven years given new technology and optimized operating environments, most miners generally depreciate their rigs over a shorter period out of conservatism. Riot and Hut 8, for example, depreciate their rigs over two years, while Marathon depreciates its rigs over five years. Note that older rigs often have lower depreciation expense, either because they are sometimes fully depreciated already or because they were purchased before bitcoin’s latest run when the rig price, and therefore amount of resulting depreciation, was much lower.
- Infrastructure: For those that own their own mining facilities, infrastructure is held at cost and depreciated using the straight-line method over the asset’s estimated useful life. Riot, for example, depreciates buildings and improvements over 10-25 years and machinery and facility equipment over 5-7 years, while Hut 8 depreciates its infrastructure assets over a 10-year useful life. Again, miners that outsource the deployment and hosting of machines to third-party hosting providers pay hosting fees rather than depreciate their infrastructure.
- General & Administrative: G&A expenses include salaries and stock-based compensation, marketing expense, professional fees, insurance, and other general expenses.
- Impairment: Most miners will review long-lived assets for impairment. One such asset is digital currencies, which are typically accounted for as intangible assets with indefinite useful lives recorded at cost less impairment. A miner will record an impairment expense when the carrying amount exceeds the fair value of the digital asset.
In practice, miner costs may be opaque, with disclosures, categorization, and accounting treatment sometimes varying between them and inhibiting comparisons between the miners. Nevertheless, most miners report a cost of revenue line item, which generally includes all the costs directly related to the production of bitcoin such as energy costs, hosting fees, electrical components, and operational staff salaries. Cost of revenues will also include costs directly related to producing non-mining revenues as well. Lastly, some miners also include depreciation and amortization in their cost of revenues while others do not, but all typically specify the amount of depreciation and amortization in their regulatory filings even when included in the cost of revenues.
We attempt to re-categorize expenses as consistently as possible and exclude non-operating/ non-recurring items such as digital asset and other impairment charges, fair value changes, and legal settlements to compare miner expense composition below. Cost of revenue, which again mainly includes the cost of power, facilities operating costs, and/or hosting fees, generally amounts to 30-50% of a miner’s total operating expenses. Depreciation and amortization expense, by contrast, tends to be much smaller, while other operating expenses such as compensation, rent, insurance, technology, professional fees, and marketing, generally amount to 20-45% of total expenses. Note that Core Scientific’s cost of revenues is relatively high as its cost of equipment sales runs through this line, while Marathon’s other operating expense is inflated in 2021 due to elevated stock-based compensation.
Exhibit 4: Operating Expense Composition, 2021
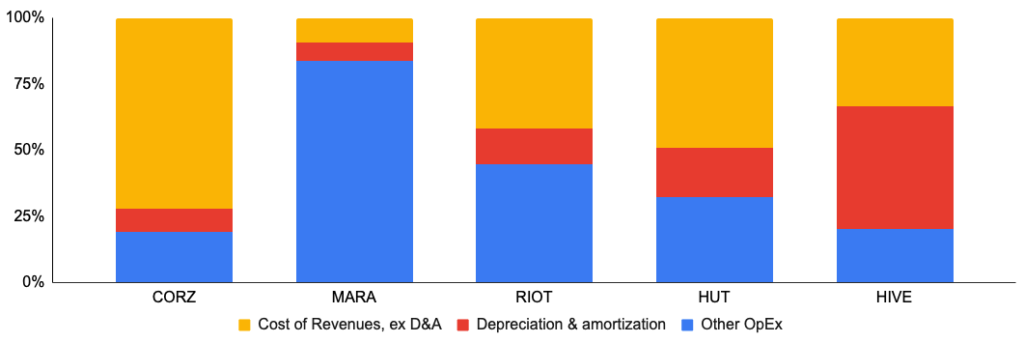
Source: Company websites, GSR
With cheap power the most important input, we show BitOoda’s estimated power and labor costs per kWh below. Hut 8 and HIVE tend to have more laddered and thus more costly fleets, though this also comes with a long history of operating experience that will help them through any future environment. We’d also note that deploying less efficient but profitable rigs may be dilutive to fleet efficiency and thus miner profitability, but is still accretive to earnings. Lastly, note that Riot’s low estimate is likely due to its Whinstone facility, which it is currently expanding to 700 megawatts of power and had a very low average self-mining net power cost of $0.027 / kWh in 2H21. While we’d classify all five miners shown below as having access to cheap power, this metric is a clear differentiator, increasing profitability during the good times and allowing miners to survive during the inevitable crypto winters.
Exhibit 5: BitOoda Estimated Power & Labor Costs, Cents per kWh
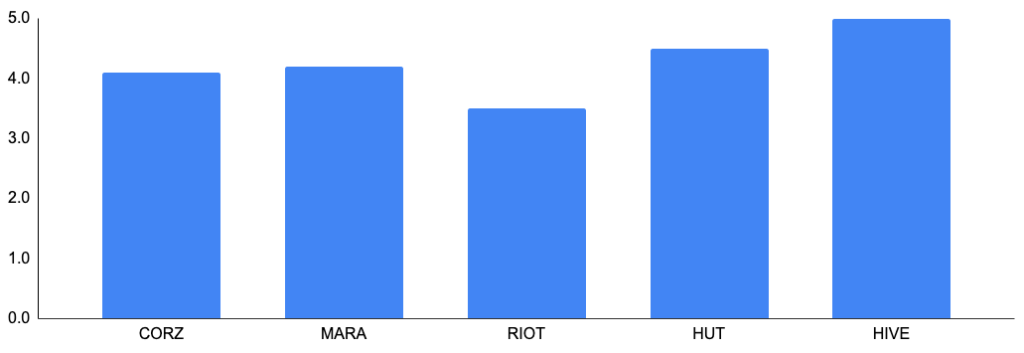
Source: BitOoda, GSR
Several miners reference their cost of mining a single bitcoin in filings or company presentations. This can be thought of as both the breakeven cost of mining as well as an indication of profitability. For example, a miner with an $8,000 cost to mine one bitcoin when the price of bitcoin is at $40,000 will mine at an 80% gross mining margin. When analyzing cost per bitcoin, however, it’s important to understand the methodology used, as there can be differences in reporting between firms. Some miners like Marathon show a marginal cost of production that assumes hardware is already in place, so the incremental cost to mine bitcoin is only the cost per kWh of power and hosting. This amounted to a cost per bitcoin of $5,087 for Marathon in 4Q. Other miners like Hut 8 reference a cost to mine bitcoin based on the total cost of revenue excluding depreciation, so they are further incorporating expenses like personnel, network monitoring, equipment repair, and maintenance costs to form a more comprehensive cost of mining. This amounted to a cost per bitcoin of $21,912 for Hut 8 in 4Q. Below we show an estimated cost per bitcoin for the miners from The Block, which attempts to standardize the calculation between firms. Note that both company-stated cost per bitcoin and The Block’s estimates exclude depreciation as it is a non-cash expense and given varying accounting treatment, though the total cost to mine bitcoin inclusive of the investment in rigs is higher than what’s shown below.
Exhibit 6: The Block Estimated Costs to Mine One Bitcoin, $Thou
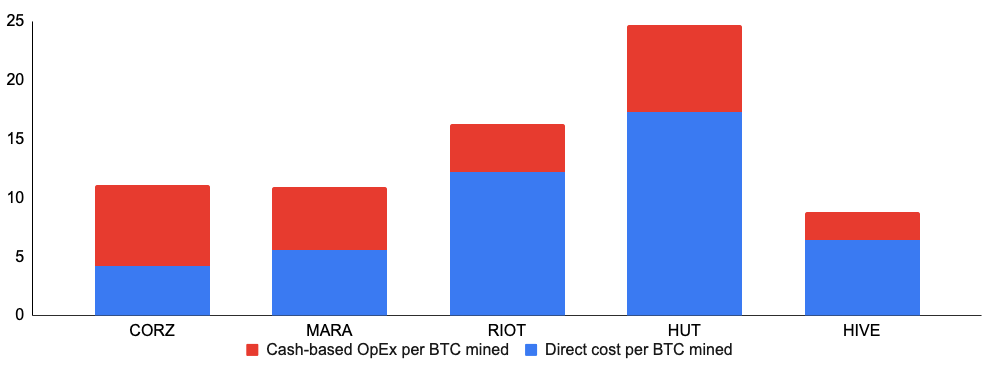
Source: The Block, GSR
Note: Figures are for 9M21, except for HIVE, which is for 2021. HIVE mined 1,765 BTC and 41,965 ETH in 2021, and uses the average 0.055BTC/ETH for 2021 to calculate HIVE’s costs shown above.
Bitcoin Mining Profitability
Putting it all together, one can see that miner profitability is driven by optimizing revenues, determined mainly by hashrate market share and the price of bitcoin, and expenses, determined by a miner’s ability to procure inputs cheaply and operate efficiently.
Two key items outside of a miner’s control that will have an outsized impact on profitability are the network hashrate and the price of bitcoin. The two tend to move together, as a rising price of bitcoin attracts greater investment in hashrate and can make unprofitable, offline rigs profitable again, while a falling price of bitcoin can reduce investment and cause miners to power rigs down. However, the network hashrate and price do not always move together, as was the case in the second half of 2021 after China banned mining. Though rigs are portable, the process of moving them isn’t immediate and there was also a lack of sufficient infrastructure with cheap power in other jurisdictions to immediately accommodate all of China’s rigs. As such, the price of bitcoin recovered and reached new heights but the network hashrate only did so more slowly, allowing miners outside of China to benefit from high bitcoin prices as well as a low network hashrate.
To illustrate why the network hashrate and the price of bitcoin should be considered together, we provide the following example. A miner with 4 EH/s will garner a 2% hashrate market share when the network hashrate is at 200 EH/s, allowing them to produce 2% of the 900 bitcoins created by the industry each day, or 18 bitcoin. At a price of $40,000 per bitcoin, this amounts to $720,000 in daily revenue. If the price of bitcoin falls 10%, this would appear negative for the miner at first glance. However, if the price decline occurred alongside a 10% decline in the network hashrate, the miner is actually no worse off as long as they are still running. This is because a 10% decline in the 200 EH/s network hashrate results in a 180 EH/s network hashrate, and a 2.22% hashrate market share with the miner still at 4 EH/s. This would allow the miner to now produce 20 bitcoin each day rather than the original 18. Thus, after the 10% decline in the price of bitcoin to $36,000, daily revenues amount to $720,000, the same as before.
Exhibit 7: Bitcoin Price vs. Network Hashrate, Last Three Years
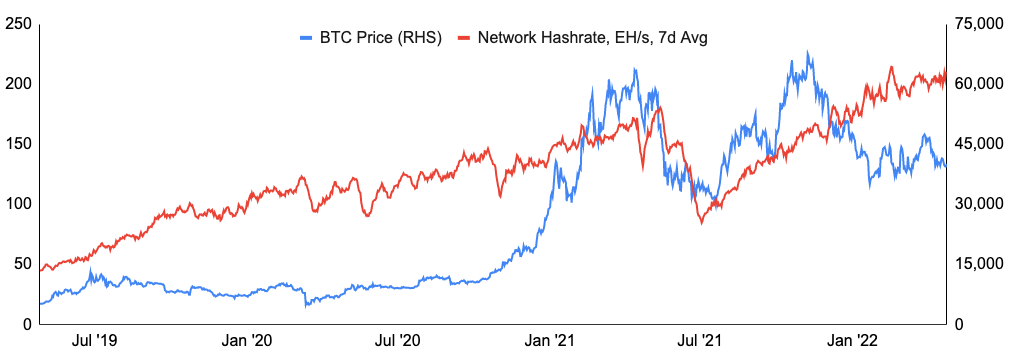
Source: Blockchain.com, Santiment, GSR
Another way to illustrate this is to look at the daily profitability of bitcoin mining, as measured in US dollars per day for 1 TH/s of hashrate. Over the last 12 months, the industry has made between $0.16 and $0.46 per day for each TH/s of hashrate. We show each day’s profitability below represented by the size of the bubble, with larger bubbles representing higher profitability. We then chart the daily profitability against the network hashrate and the price of bitcoin to show that the highest profits occur when the price of bitcoin is high and the network hashrate is low. Conversely, profitability falls materially when the price of bitcoin is low and the network hashrate is high.
Exhibit 8: Bitcoin Mining Daily Profitability (USD per day for 1 TH/s) vs. Bitcoin Price and Network Hashrate, LTM
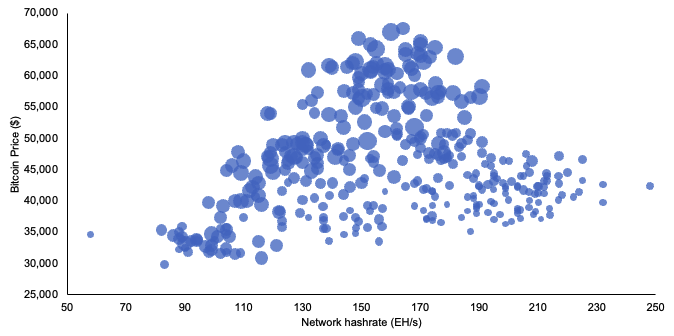
Source: Bitinfocharts.com, Blockchain.com, Santiment, GSR
Note: Mining profitability is measured as the daily $ profit per 1 TH/s of hashrate and it is denoted relatively by the size of the bubbles.
At the company level, there are various profitability metrics such as the overall company gross margin, the self-mining business gross margin, and the adjusted EBITDA margin. Below we show the overall gross margin and the mining gross margin. Note that we use company-given margins where disclosed so the metrics may not be perfectly comparable. Nevertheless, in addition to efficiency, business mix plays a large part in determining the overall gross margin. Marathon, for example, reported a particularly strong gross margin in 2021 due in part to only having a self-mining business, which exhibited particularly strong returns last year. Core Scientific, by contrast, reported a much lower gross margin, which was heavily influenced by its large equipment sales and hosting businesses that tend to have lower profitability relative to 2021’s self-mining performance. Turning to the gross margin of the mining business, which removes the impact of business mix, we can see that HIVE had the strongest gross mining margin last year likely due at least in part to its large Ethereum mining operation, which was particularly profitable last year. Hut 8, by contrast, reported a lower gross margin for the mining business, likely due in part to its laddered fleet and what may be higher power costs that should improve as its new North Bay facility with a $0.027 CAD/kWh power cost ($0.021 USD / kWh) fills out.
Exhibit 9: Gross Margins – Total and Mining Operations, 2021
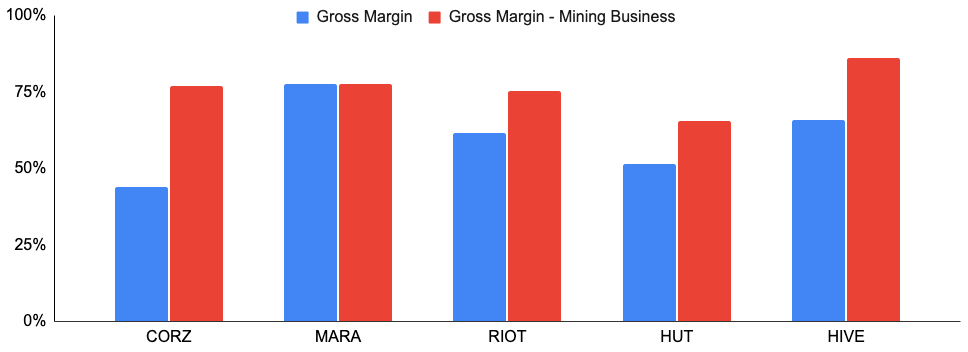
Source: Company websites, GSR
Note: HIVE’s gross margin and HUT’s mining gross margin are estimated.
Competitive Strategies
Mining is a highly competitive business, with miners around the globe continuously hashing away day and night, 365 days a year. Miners compete on many fronts, including securing cheap power, acquiring ASICs, and raising capital. In addition, miners must decide whether to acquire assets directly or to leverage third-party service providers, where to locate, which rigs to utilize, and whether to sell or HODL mined bitcoin, among many other decisions. And, miners must make these decisions in light of many future unknowns, making the optimal decision difficult to discern ex-ante. In more detail major strategic decisions include:
- Hosting Infrastructure: As touched upon in the prior piece, miners may own the mining facilities they utilize, or they may purchase hosting services from a third-party hosting provider. Proponents of the former strategy argue that it reduces the expenses paid to third parties, secures future hosting needs, increases day-to-day operating control, creates long-term value given a longer infrastructure useful life, and enables the sale of hosting services with excess capacity. Proponents of the latter strategy, often referred to as an asset or capital-light strategy, believe that it’s more profitable to forgo investing in infrastructure in favor of acquiring more ASICs and maximizing hashrate sooner, especially in light of a rising network hashrate and the decreasing nature of block rewards. In addition, using hosting providers increases operational flexibility, allowing the miner to more easily change jurisdictions, move mining sites, or turn off power should regulations, power costs, or mining profitability change. Below we show a calculation from Marathon arguing that an asset-light model provides a greater return than owning both the rigs and the infrastructure. Note, however, that Riot provides a similar model in its investor presentation, but one which comes to the opposite conclusion and shows a vertically integrated approach is better. We believe that the conclusion is heavily influenced by the assumptions used, with some of the key differences between Marathon and Riot’s assumptions being the cost and useful life of electrical infrastructure, other infrastructure costs, and the assumed future price of bitcoin.
Exhibit 10: Marathon’s Asset Light Vs. Vertical Integration Return Projections
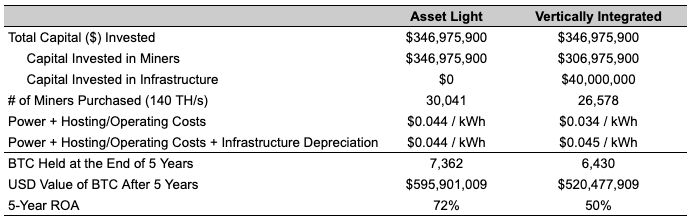
Source: Marathon Digital Investor Presentation, GSR
- Facility Location: Miners desire cheap, stable electrical power while minimizing regulatory and political risks. As such, miners prioritize geographies that offer cheap energy assets, a reliable power grid, and a stable regulatory environment with a strong rule of law. That said, some miners have facilities located in multiple countries, which can help diversify these risks. We include much more detail on the considerations behind facility selection in part two of this series.
Exhibit 11: Mining Facility Locations
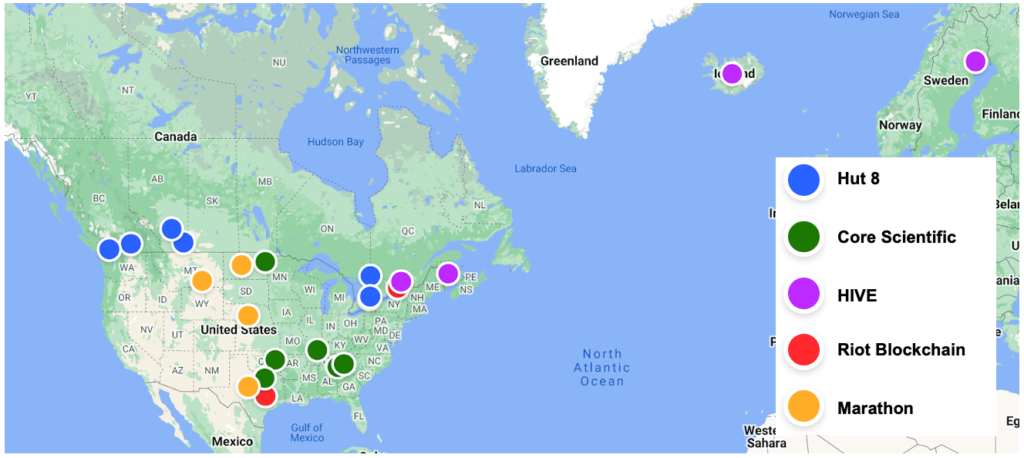
Source: Company websites, GSR
Note: Core Scientific’s facility in Muskogee, OK is in progress and not yet operational. Core Scientific additionally has two facilities in Georgia and North Carolina, but only one is shown in each of these states on the map. Hut 8 facilities are a mix of mining facilities and traditional data center operations. The two facilities in Alberta, as well as the facility in North Bay, Ontario are their three crypto mining facilities, while the four remaining facilities are traditional data centers. Marathon leverages 3rd party hosting providers and they do not disclose the number of facilities they use or which cities they are in outside of the Hardin facility. Hence, we highlight the states in which Marathon deploys miners, but we’d note that this may not be an exhaustive list.
- Sell or HODL Production: Many early Bitcoin miners entered the space due to a strong fundamental belief in the asset and the underlying technology. This resulted in many miners holding on to their bitcoin production, aiming to benefit from the rising price of bitcoin. Historically, this hasn’t always been possible as miners had limited access to external funding and needed to pay monthly fiat-based costs. More recently, however, high profitability has led to greater access to capital for institutional miners, allowing them to finance day-to-day operations with externally-raised capital so they can HODL their bitcoin. These large institutional miners prefer to do so as they believe in the future of the asset, and it additionally attracts institutional investors looking to access bitcoin-like returns without having to worry about custody or the inefficiencies of futures-based ETFs. Recently, however, some miners who have been HODLing have sold a portion of their production.
- Financing: Miners have predominantly financed their operations through equity raises, and equity continues to make up the vast majority of their capital structure today. However, miners have increasingly used loans and debt instruments over the last six to nine months. The most prominent lenders, which often use miner-owned bitcoin and rigs as collateral, have been crypto-native companies, crypto-focused banks, and private credit funds, such as NYDIG, Genesis, Silvergate, and Galaxy Digital. Miners are also starting to issue hybrid debt, as exemplified by Marathon’s November 2021 $650m convertible note issuance. As the industry matures and debt financing becomes more accessible, miners will likely have an opportunity to employ more efficient financing.
- Mining Mix: Most large miners have prioritized bitcoin mining, but some also mine Ethereum and to a lesser extent, other tokens. Out of the five miners covered in this piece, only Hut 8 and HIVE have disclosed mining coins outside of bitcoin in any material size. Both Hut 8 and HIVE mine Ethereum at very attractive economics today, but this revenue stream will likely decrease as Ethereum transitions to proof-of-stake and both Hut 8 and HIVE switch to mining other GPU-mineable tokens. Currently, Ethereum mining makes up ~13% and ~39% of Hut 8 and HIVE’s bitcoin-equivalent hashrate, respectively. Hut 8 has contracted with its pool operator to receive ether mining rewards paid in bitcoin, so it is currently mining bitcoin indirectly through Ethereum at a cost of ~$2,000 per bitcoin, a level much cheaper than even the most cost-efficient bitcoin miners.
- Asset Management: Miners that maintain bitcoin on their balance sheet must decide how to manage it. Miners may simply maintain the assets in cold storage, lend them out to generate yield or use as collateral for a loan. In theory, miners may one day be able to generate enough yield on their HODL to cover operating expenses, never needing to sell production and only needing outside capital for growth.
- Hedging: While most commodity producers hedge at least some amount of future production, most public bitcoin miners choose not to do so for the same reasons they decide to HODL – to gain exposure to future bitcoin prices and to increase investor demand for their stock. As such, hedging has not been a large part of most public miners’ operations to date. Miners may also utilize electricity futures, though in practice most miners operate with long-term power agreements, making this less relevant than other hedging solutions. Lastly, there is an array of more exotic, Bitcoin-specific derivatives that may see increasing utilization as the industry matures. For example, BitOoda has historically executed hashrate futures, transaction fee swaps, and difficulty swaps on behalf of mining clients.
- ESG: Bitcoin miners have frequently been in the crosshairs of environmentalists, and mining operators need to determine how to position their business from an ESG perspective and have a strategy for addressing these concerns. Miners wishing to decrease their carbon footprint may prioritize renewable energy, purchase carbon offsets, or mining with flared gas, coal refuse, or some other medium that improves the health of the environment. This will be covered at length in our final part of this series.
Miner Profiles & Valuation
Core Scientific (NASDAQ: CORZ)
Based in Austin, TX, Core Scientific is the largest publicly traded, US-based crypto miner and hosting service provider. Founded in 2017, Core Scientific currently operates six data centers across North Carolina, Georgia, North Dakota, and Kentucky, with two additional data centers being developed in Texas and Oklahoma. Historically, the company predominantly generated revenue through third-party hosting services, but the company expanded its self-mining capabilities in July 2021 by acquiring Blockcap, one of its largest hosting customers. The company also generates a meaningful portion of revenue by securing ASICs and selling them to its hosting client base. Core Scientific was acquired in July 2021 by an energy-focused SPAC and began trading on the NASDAQ in January 2022 upon completion of the deal. Core Scientific is net carbon neutral, purchasing renewable energy credits to offset any carbon-emitting energy utilized.
Marathon Digital Holdings (NASDAQ: MARA)
Based in Las Vegas, NV, Marathon is the second-largest publicly traded Bitcoin miner in the US. Founded in 2010, the company historically operated a diverse set of businesses prior to entering the digital asset mining space in November 2017. Marathon employs a more nimble, capital-light strategy, predominantly leveraging third-party hosting infrastructure and deploying the freed-up capital into extra mining rigs. Marathon has miners deployed across South Dakota, Nebraska, Montana, and Texas, and primarily leverages Compute North facilities that tap off-grid renewable energy sources. Additionally, Marathon owns and operates Marapool, its own mining pool. Marathon aims to be 100% carbon neutral by year-end 2022.
Riot Blockchain (NASDAQ: RIOT)
Based in Castle Rock, CO, Riot is one of the largest publicly traded bitcoin miners and hosting service providers in the US. Riot began mining in 2018, and its fleet is deployed across its own facilities and third-party hosted facilities. In April 2021, Riot announced the acquisition of Whinstone US, the owner/operator of North America’s largest Bitcoin mining and hosting facility in Rockdale, TX. The facility featured 300 MW of developed capacity and Riot quickly embarked on an incremental 400 MW expansion plan. In addition, Riot recently announced plans for a massive 1 GW (1,000 MW) development in Navarro County, Texas with the first phase expected to commence mining and hosting operations in July 2023. Riot is the first miner to deploy an industrial scale liquid immersion mining operation, where chips are cooled via liquid immersion rather than traditional air cooling to generate extra hashrate.
Hut 8 Mining (TSE: HUT)
Based in Toronto, ON, Hut 8 is one of Canada’s largest publicly traded crypto miners and data center providers. The company began mining in 2017, and it operates three mining facilities across Alberta and Ontario. Further, Hut 8 is an authorized MicroBT repair shop, reducing rig downtime via on-site repairs, adding additional revenues, and strengthening its with the manufacturer. Hut 8 also utilizes its GPU fleet to mine Ethereum at very attractive economics. In January 2022, the company acquired TeraGo’s cloud and colocation data center business and it now operates five traditional data centers spanning the tier spectrum and supporting over 400 commercial customers in verticals such as gaming, media & entertainment, and government contracts. Hut 8 is aiming to be net carbon neutral by 2025.
HIVE Blockchain (CVE: HIVE)
Based in Vancouver, B.C., HIVE is one of Canada’s largest publicly traded crypto miners and hosting service providers. The company began mining Ethereum in 2017 as it acquired GPUs from a data center operator in Iceland. HIVE mines a diversified mix of bitcoin and Ethereum today, maintaining both exposures on its balance sheet. HIVE primarily deploys its machines at third-party hosted facilities spanning Quebec, Iceland, Sweden, and soon-to-be Texas, but HIVE did acquire one facility outright in New Brunswick. HIVE’s facilities are powered by clean hydroelectric and geothermal power.
Exhibit 12: Mining Company Background Information
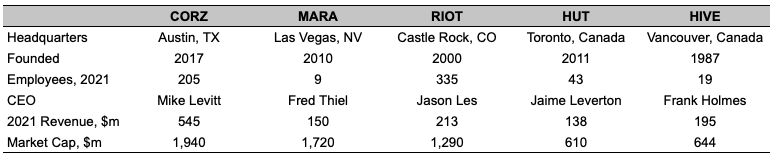
Source: Company websites, Yahoo Finance, GSR
Below we provide an overview of mining company operations. Hashrate is perhaps the most important controllable metric to monitor, and as such, many public miners will provide monthly updates as well as future hashrate guidance. It’s also useful to track the various inputs into hashrate, including both the current status of these inputs as well as progress on stated development. These include:
- Power: Power may be the most scarce asset in the industry and is a measure of developed capacity. Miners will also announce planned power for facilities in development, and it’s important to follow the progress of such facilities as an indication of the level and timing of future hashrate.
- Rigs: Rig orders and deliveries should be watched as rigs are ordered with large lead times and are often subject to delays. Rig characteristics should also be observed. For example, rig efficiency, which is measured in Joules / TH, allows miners to produce a higher hashrate with the same power footprint and impacts rig profitability. There has likely been less focus on efficiency given such strong margins, but should the price of bitcoin stall and profitability fall, efficiency will likely come to the fore.
Exhibit 13: Bitcoin Mining Company Operations Overview
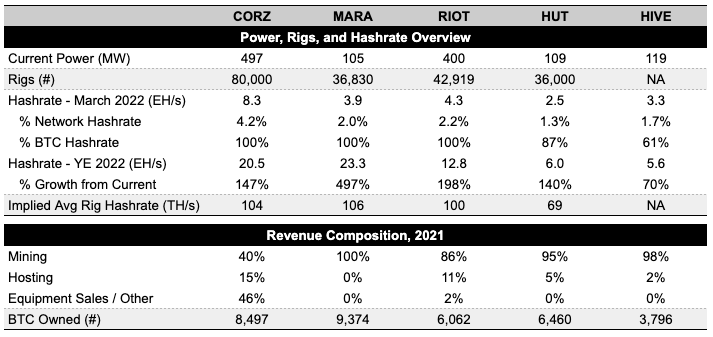
Source: Company websites, GSR
Note: Power from company disclosed dated Dec ’21-Mar ’22, though differ on the exact point in time of the measurement. CORZ represents total company power, including for hosting. Rigs is for March for CORZ, MARA, and RIOT; HUT rigs are estimated based on numbers indicated in their 40-F filing as of Dec 21. Hashrate denotes a miner’s hashrate used for self-mining and it excludes any hashrate that they may host for other miners. Hashrate numbers are shown in bitcoin-equivalent terms and may represent a mix of BTC/ETH hashrate. Future hashrate targets for Marathon and Riot are estimates for Q1 2023 and Jan 2023, respectively, as opposed to December 2021 for the others. BTC owned for HIVE includes ETH HODL converted to BTC-equivalent.
Bitcoin Mining Stocks and Valuation
There are over 25 public bitcoin mining companies, with several more on the way and up significantly from a few years ago. This flurry of new listings has occurred as investor appetite for bitcoin exposure has increased and as mining companies seek access to capital via the public markets. Such capital has allowed public bitcoin miners to significantly expand hashrate market share from a mere 3% at the beginning of 2021 to 19% currently, per Arcane Research. And as we’ve shown above, public miners should continue to materially increase this percentage going forward.
As the price of bitcoin impacts miner earnings as well as the value of any digital assets on balance sheet, miner stocks have a high correlation with bitcoin, ranging from 0.60 to 0.75 recently. In fact, one simplistic view of the value of a bitcoin mining company’s stock is the present value of all future bitcoin mined plus any HODL (ignoring hosting and other businesses, which are small for most). Additionally, bitcoin mining stocks tend to be much more volatile than the stock market or even bitcoin itself. We believe mining stocks are more volatile than bitcoin for several reasons. First, revenues are directly impacted by the price of bitcoin, while expenses are much less and only indirectly so, causing an amplified impact on near-term earnings from changes in the price of bitcoin. In addition, the majority of value ascribed to a miner can be attributed to future bitcoin production, so any change in the current price of bitcoin will impact the present value of this. Lastly, we believe the level of volatility is also due to the nascency of the industry and high level of uncertainty.
Exhibit 14: Stock Price vs. Bitcoin Price, Last 12 Months, April 20, 2021 = 100
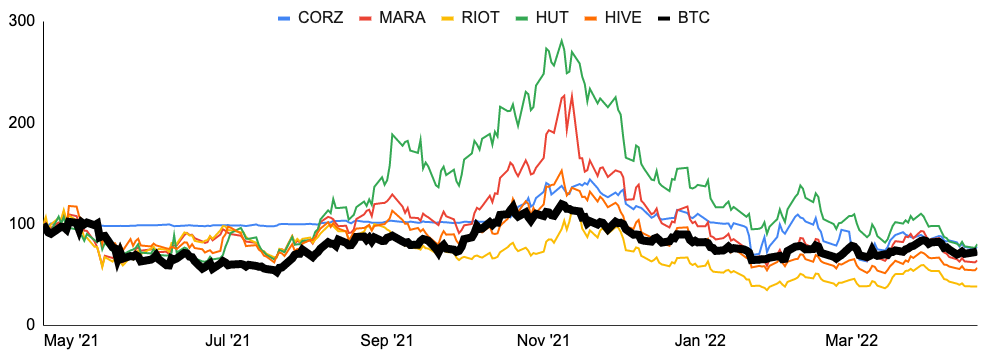
Source: Google Finance, Santiment, GSR
Note: CORZ went public on January 20, 2022 via a SPAC deal with Power & Digital Infrastructure Acquisition Corp (NASDAQ: XPDI).
Investors in bitcoin mining stocks hold an inherent belief in the asset and are expressing a view that it is more profitable to invest in an entity that can extract and HODL bitcoin at a small fraction of its market price rather than hold bitcoin outright. However, high earnings volatility/ poor earnings visibility and future halvings are perhaps the biggest arguments against owning the stocks. Below we present the more frequent components to both the bull and bear theses for bitcoin mining stocks.
Exhibit 15: Bitcoin Mining Stocks Bull-Bear Theses
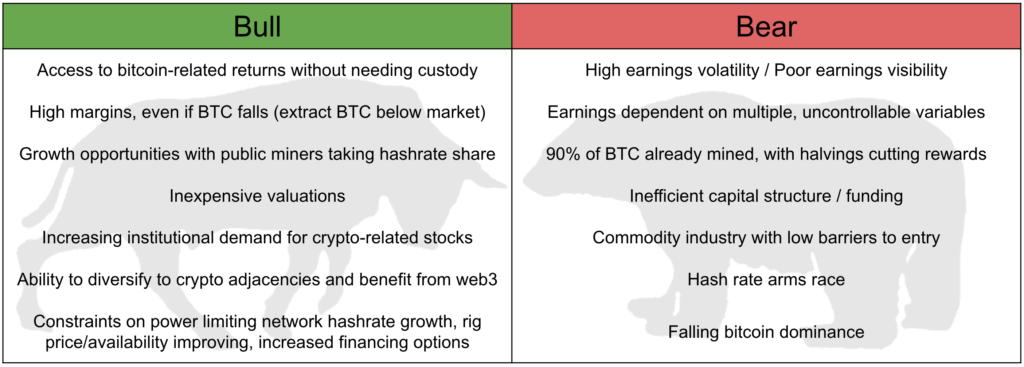
Source: GSR
When deciding on which bitcoin mining stocks to buy, analysts will often base their theses on a variety of items. These may include buying the stocks of miners that align with their views around strategy, business lines, mining exposures, revenue and expense opportunities, and ability to execute and meet or exceed guidance. For example, one may buy Core Scientific for a more diversified business in case the price of bitcoin falls, Marathon for its an asset-light strategy, Riot for the likely lowest power-cost producer, Hut 8 for exposure to blockchain/web3 growth or the opportunity to lower mining costs over time, or HIVE for exposure to Ethereum mining. All of these theses of course depend on performance relative to market expectations and valuation.
On that note, there is a very high level of dispersion in analyst estimates, making consensus estimates less reliable than more mature, well-covered industries, in our view. As such, we show a variety of mining company multiples using estimates from DA Davidson, which we trust and believe are modeled particularly well. As shown below, bitcoin mining stocks trade at a discount to the market and to fintech peers given high levels of uncertainty/volatility and the bear tenants described above. Additionally, multiples highlighted in red are expensive relative to mining peers while those highlighted in green are cheap on a relative basis. With Core Scientific and Marathon more expensive on most out-year multiples, it appears that the market may be paying up for growth, or perhaps for the cheaper names, expressing some level of skepticism in hitting their numbers.
Exhibit 16: Mining Company Valuation Multiples
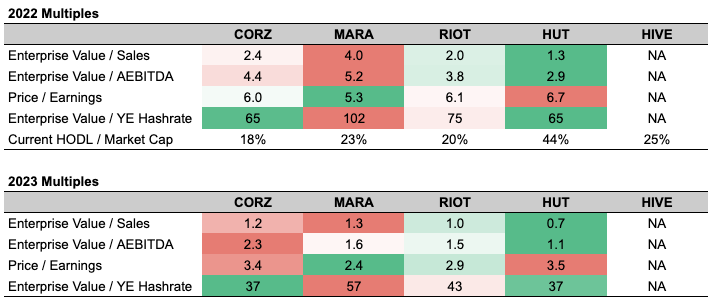
Source: DA Davidson, Yahoo Finance, Company websites, GSR
Note: Multiples based on published estimates from DA Davidson as of April 28th, except for Current HODL / Market Cap, which represents the number of bitcoin and ether on balance sheet as of company March monthly updates valued at the current prices.
In the final part of this series, we’ll take a deeper dive into Bitcoin’s energy usage and impact on the environment.
Authors:
Brian Rudick, Senior Strategist, Matt Kunke, Junior Strategist
Sources:
The authors would like to thank Chris Brendler of DA Davidson, Sue Ennis of Hut 8, and Charlie Schumacher of Marathon Digital for helpful conversations on the miners.
Core Scientific Investor Relations, HIVE Blockchain, Hut 8, Marathon , Riot Blockchain, The Block Research: Breaking down Bitcoin mining’s cost of production, Galaxy Digital: How Much Does it Cost to Mine a Bitcoin?, Wolf of All Streets Podcast with Argo CEO Peter Wall, Anthony Pompliano: Bitcoin Mining For The World: Whit Gibbs : Full Interview, Compass Podcast: An Investor’s Guide To Mining | Brandon Bailey & Lili Rhodes, The Sazmining Podcast: CEO of Marathon discusses REAL NUANCES of Bitcoin with Fred Thiel, Paul Barron Network: Marathon Digital Holdings CEO Interview
This material is a product of the GSR Sales and Trading Department. It is not a product of a Research Department, not a research report, and not subject to all of the independence and disclosure standards applicable to research reports prepared pursuant to FINRA or CFTC research rules. This material is not independent of the Firm’s proprietary interests, which may conflict with your interests. The Firm trades instruments discussed in this material for its own account. The author may have consulted with the Firm’s traders and other personnel, who may have already traded based on the views expressed in this material, may trade contrary to the views expressed in this material, and may have positions in other instruments discussed herein. This material is intended only for institutional investors. Solely for purposes of the CFTC’s rules and to the extent this material discusses derivatives, this material is a solicitation for entering into a derivatives transaction and should not be considered to be a derivatives research report.
This material is provided solely for informational purposes, is intended for your use only and does not constitute an offer or commitment, a solicitation of an offer or comment (except as noted for CFTC purposes), or any advice or recommendation, to enter into or conclude any transaction (whether on the indicative terms shown or otherwise), or to provide investment services in any state or country where such an offer or solicitation or provision would be illegal.
Information is based on sources considered to be reliable, but not guaranteed to be accurate or complete. Any opinions or estimates expressed herein reflect a judgment made as of the date of publication, and are subject to change without notice. Trading and investing in digital assets involves significant risks including price volatility and illiquidity and may not be suitable for all investors. GSR will not be liable whatsoever for any direct or consequential loss arising from the use of this Information. Copyright of this Information belongs to GSR. Neither this Information nor any copy thereof may be taken or rented or redistributed, directly or indirectly, without prior written permission of GSR. Not a solicitation to U.S. Entities or individuals for securities in any form. If you are such an entity, you must close this page.