GSR Weekly - Oct 13, 2026

Slater Santer
Research Analyst

Carlos Guzman
Research Analyst

Slater Santer
Research Analyst
Carlos Guzman
Research Analyst
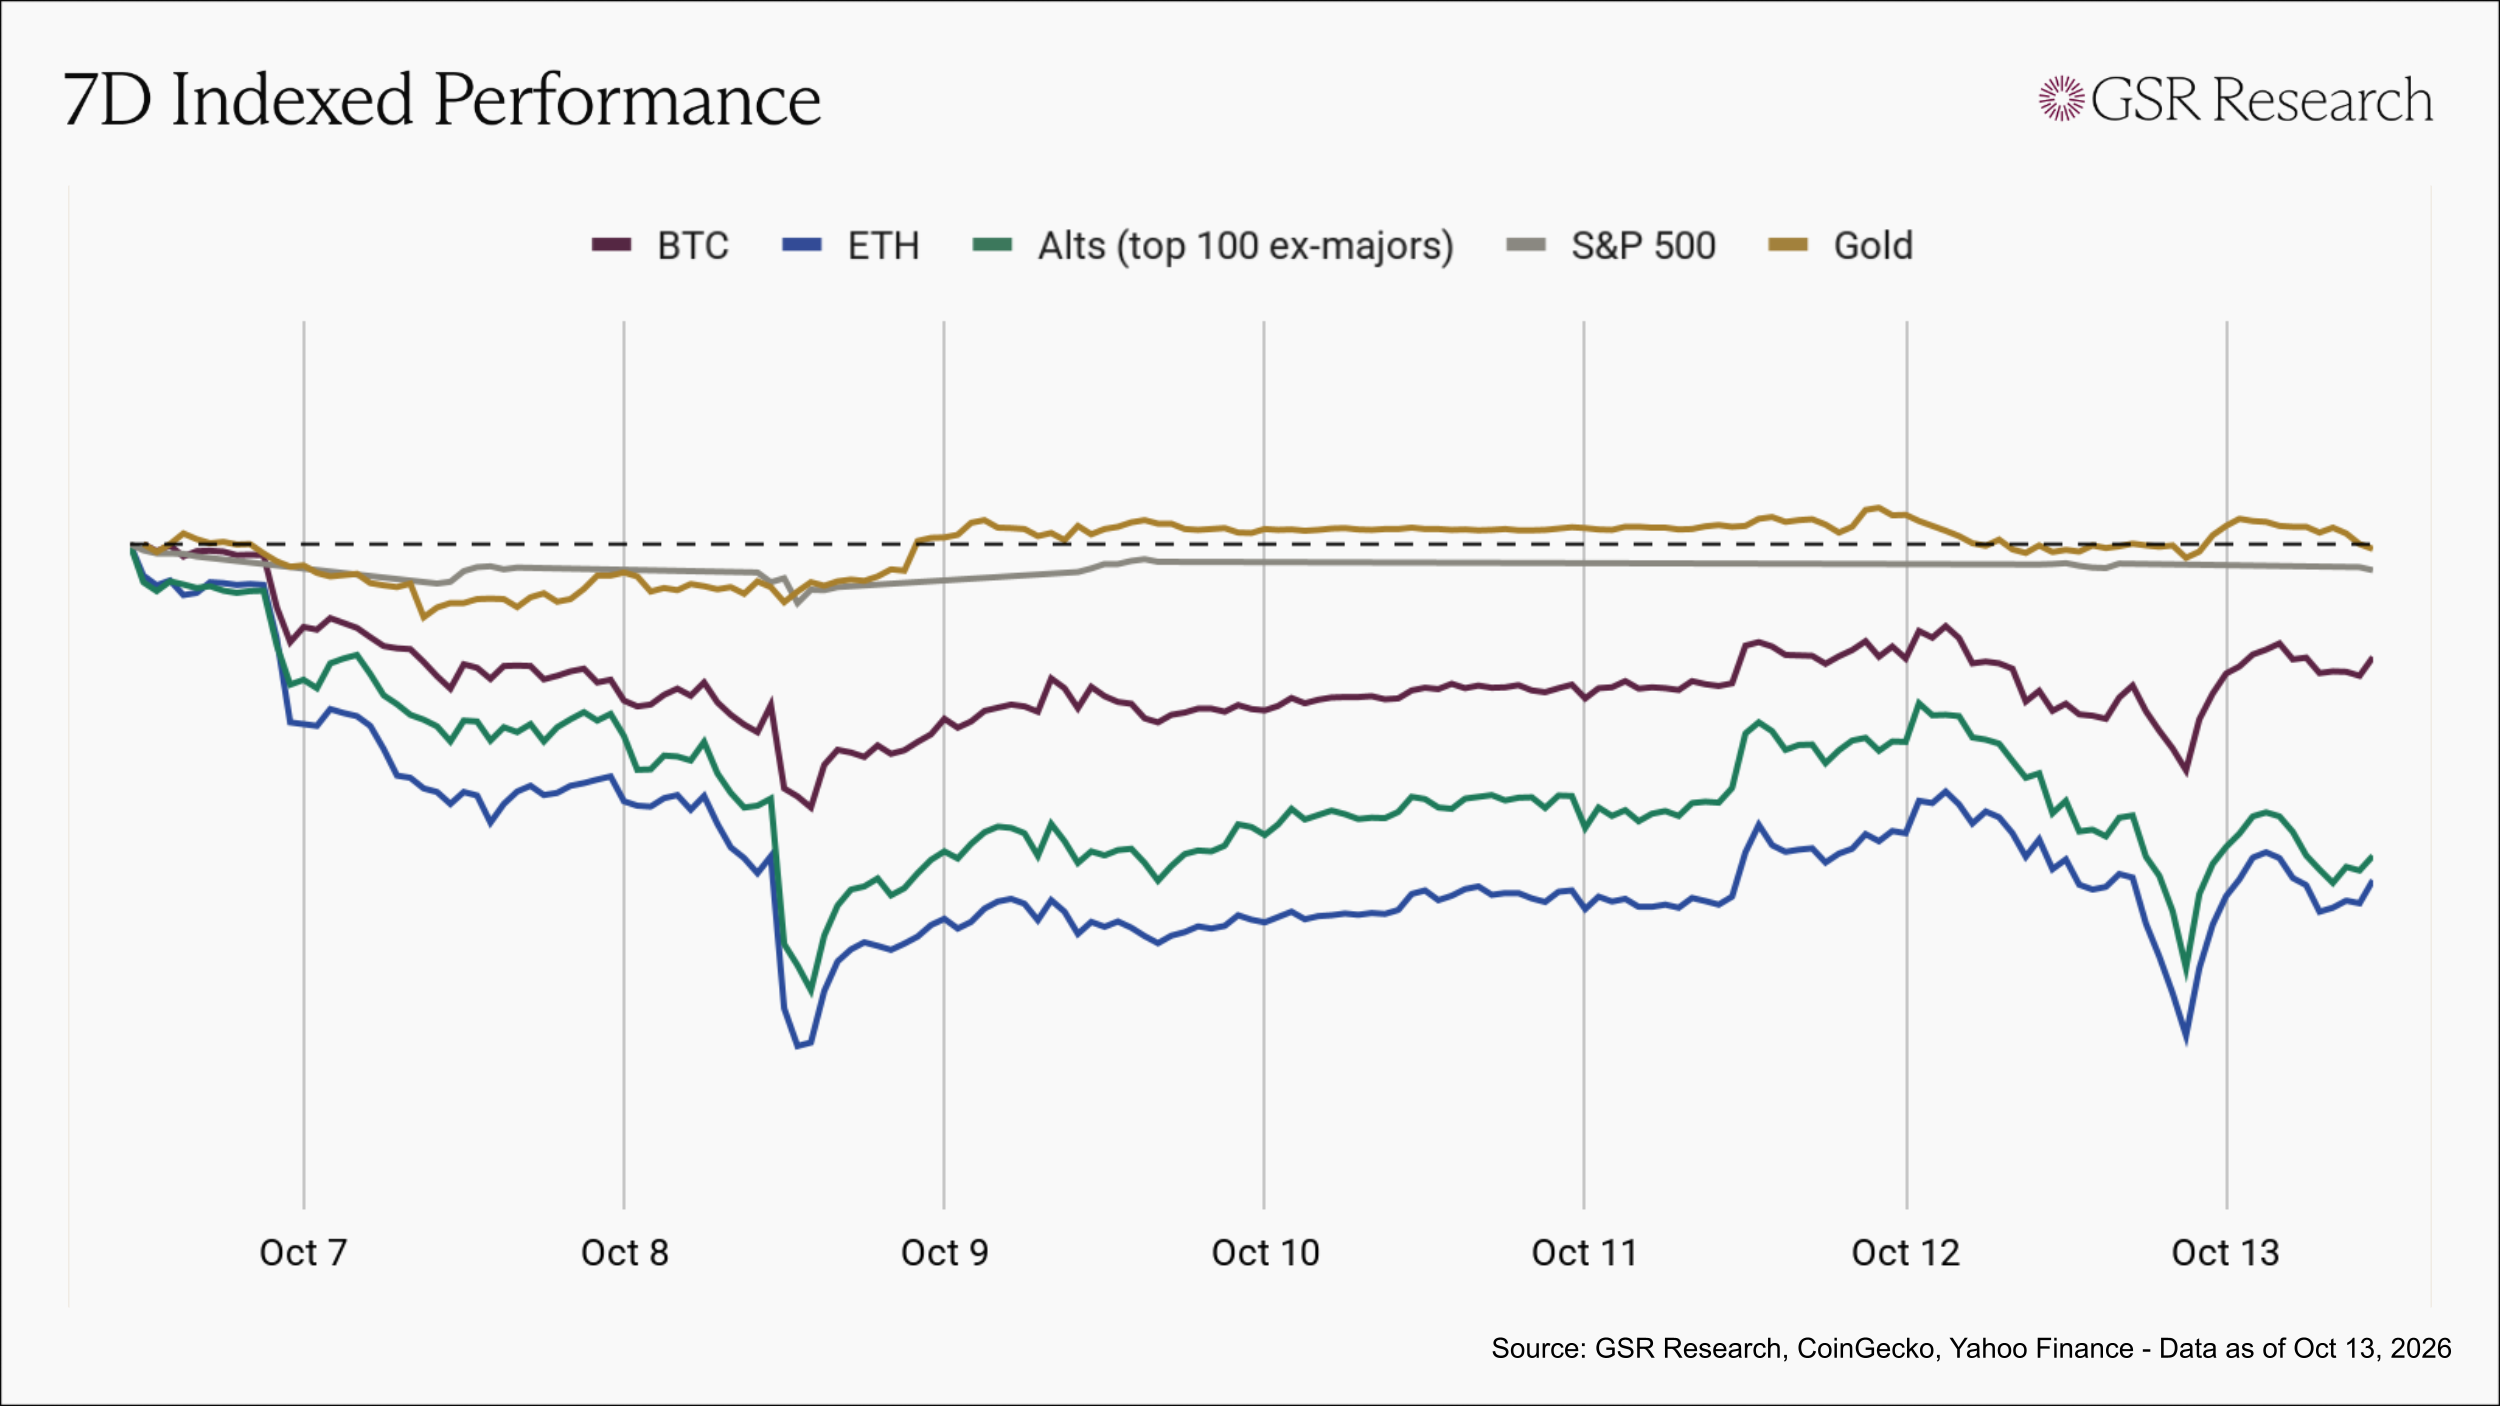
Iran stepped up its attacks on tankers in the Strait of Hormuz early in the week, causing BTC to fall from ~$86,600 on Tuesday to $83,840 by Wednesday, while the S&P 500 and Nasdaq 100 closed at new records, and Brent rose to roughly $101.50. Long-end Treasuries sold off into Wednesday's 10-year auction, with the 10-year reaching 5.36% intraday and the 30-year 5.73%, both the highest since April 2002, before the $39B sale drew strong demand, stopping through at 5.3% on a 2.77 bid-to-cover. The September FOMC minutes followed that afternoon, with most participants judging another increase likely appropriate by year end. Meanwhile, spot Bitcoin ETFs posted a $484.9M outflow on Wednesday, the largest single day of net negative flows since June 25. However, the sharpest move in Bitcoin’s price came Thursday, when an overnight attack on a tanker off Qatar and reports that the U.S. could be preparing fresh strikes on Iran sent December Brent futures to $105.65, and BTC dropped to about $80,650 with more than $1.1B liquidated market-wide in 24 hours, nearly all of it longs. Oil pared its gains after President Trump posted on Truth Social that there were no plans to attack Iran before the midterms, the $22B 30-year auction cleared at 5.618%, with above-average demand, and the 10-year dropped back to 5.23%. Spot Bitcoin ETFs returned to a $21.1M inflow on Friday while Ether funds extended their outflow streak to nine sessions. Crypto sold off again on Monday as Korean chip stocks fell on reports that China's CXMT had made progress on a denser DRAM design, with the KOSPI closing down 3.65% as Samsung and SK Hynix each lost more than 4%. BTC dropped below $82,000 that evening with $488.6M liquidated market-wide in 24 hours, 83% of it longs, before recovering above $83,000 on Tuesday.
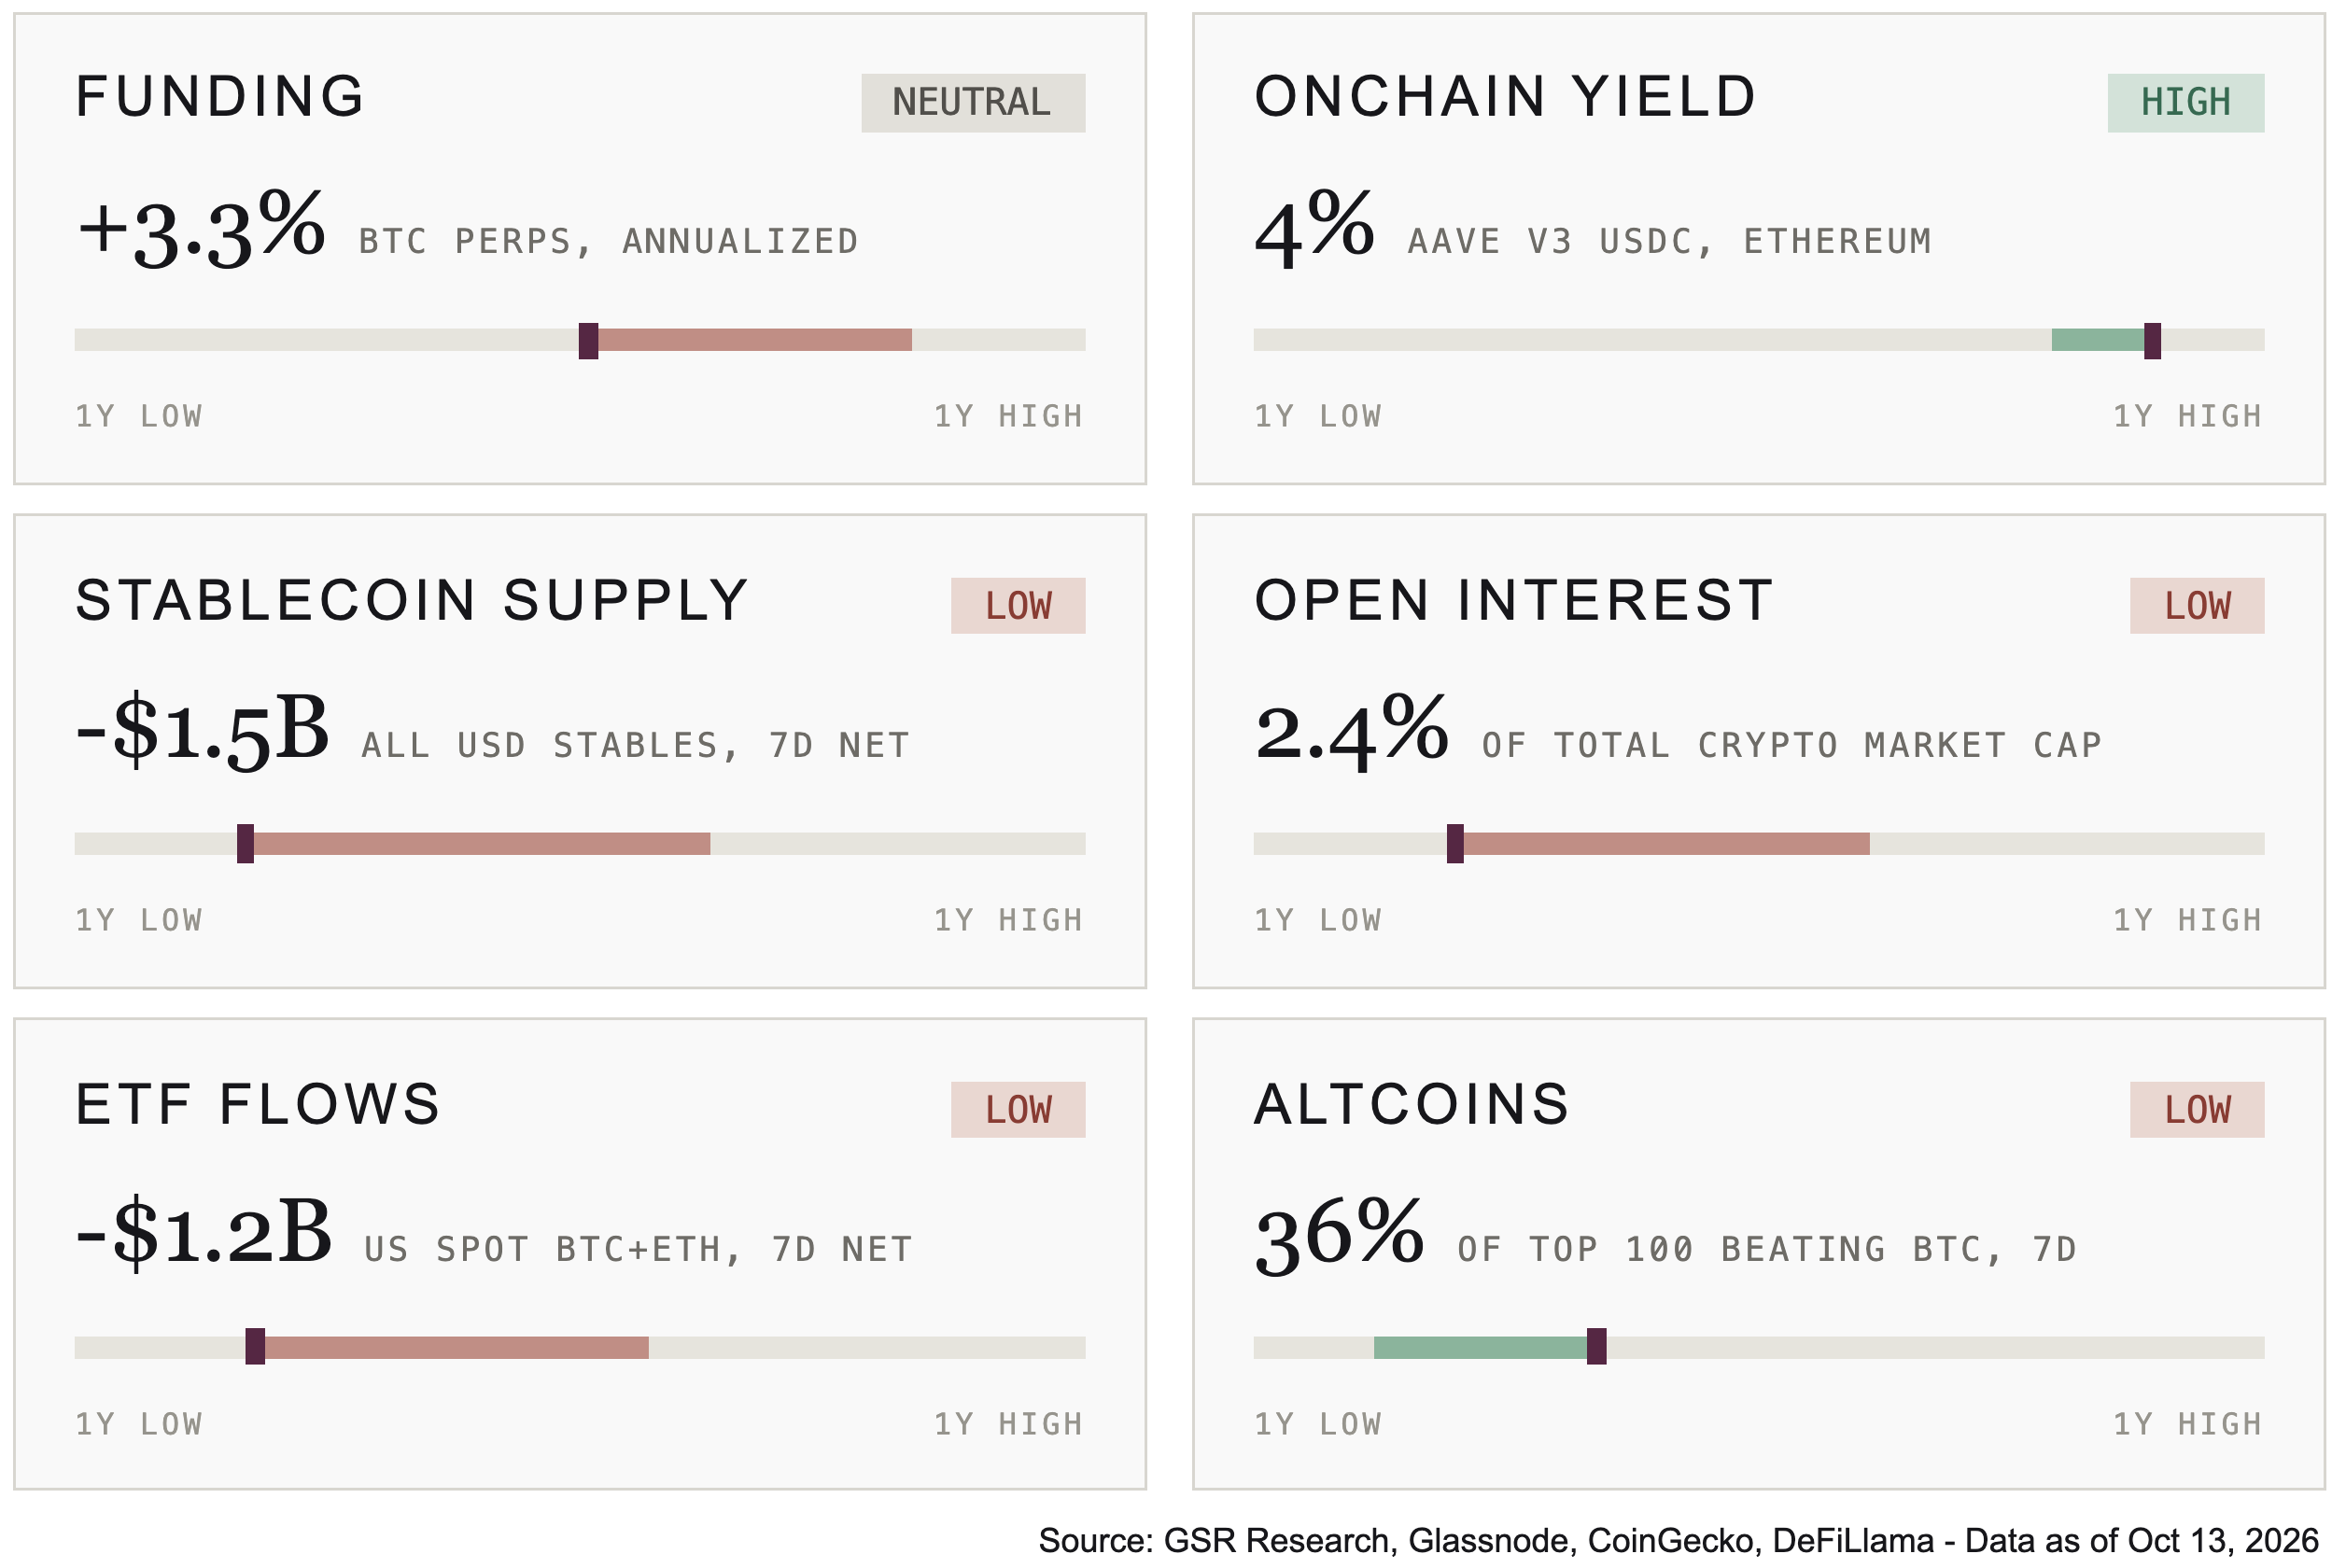
The market pulse gauges weakened this week, with four of six indicators now in the low range. Funding fell from +6.6% to +3.3% annualized, out of the high range and back to neutral, and open interest slipped from 2.6% to 2.4% of total market cap. Both flow gauges turned negative, as ETF flows dropped from +$0.1B to -$1.2B and Stablecoin Supply swung from +$0.7B to -$1.5B. Onchain yield was the exception, rising from 3.7% to 4%, near the top of its one-year range. Altcoin performance improved from 22 to 36 of the top 100 beating Bitcoin, though it remains in the low range.
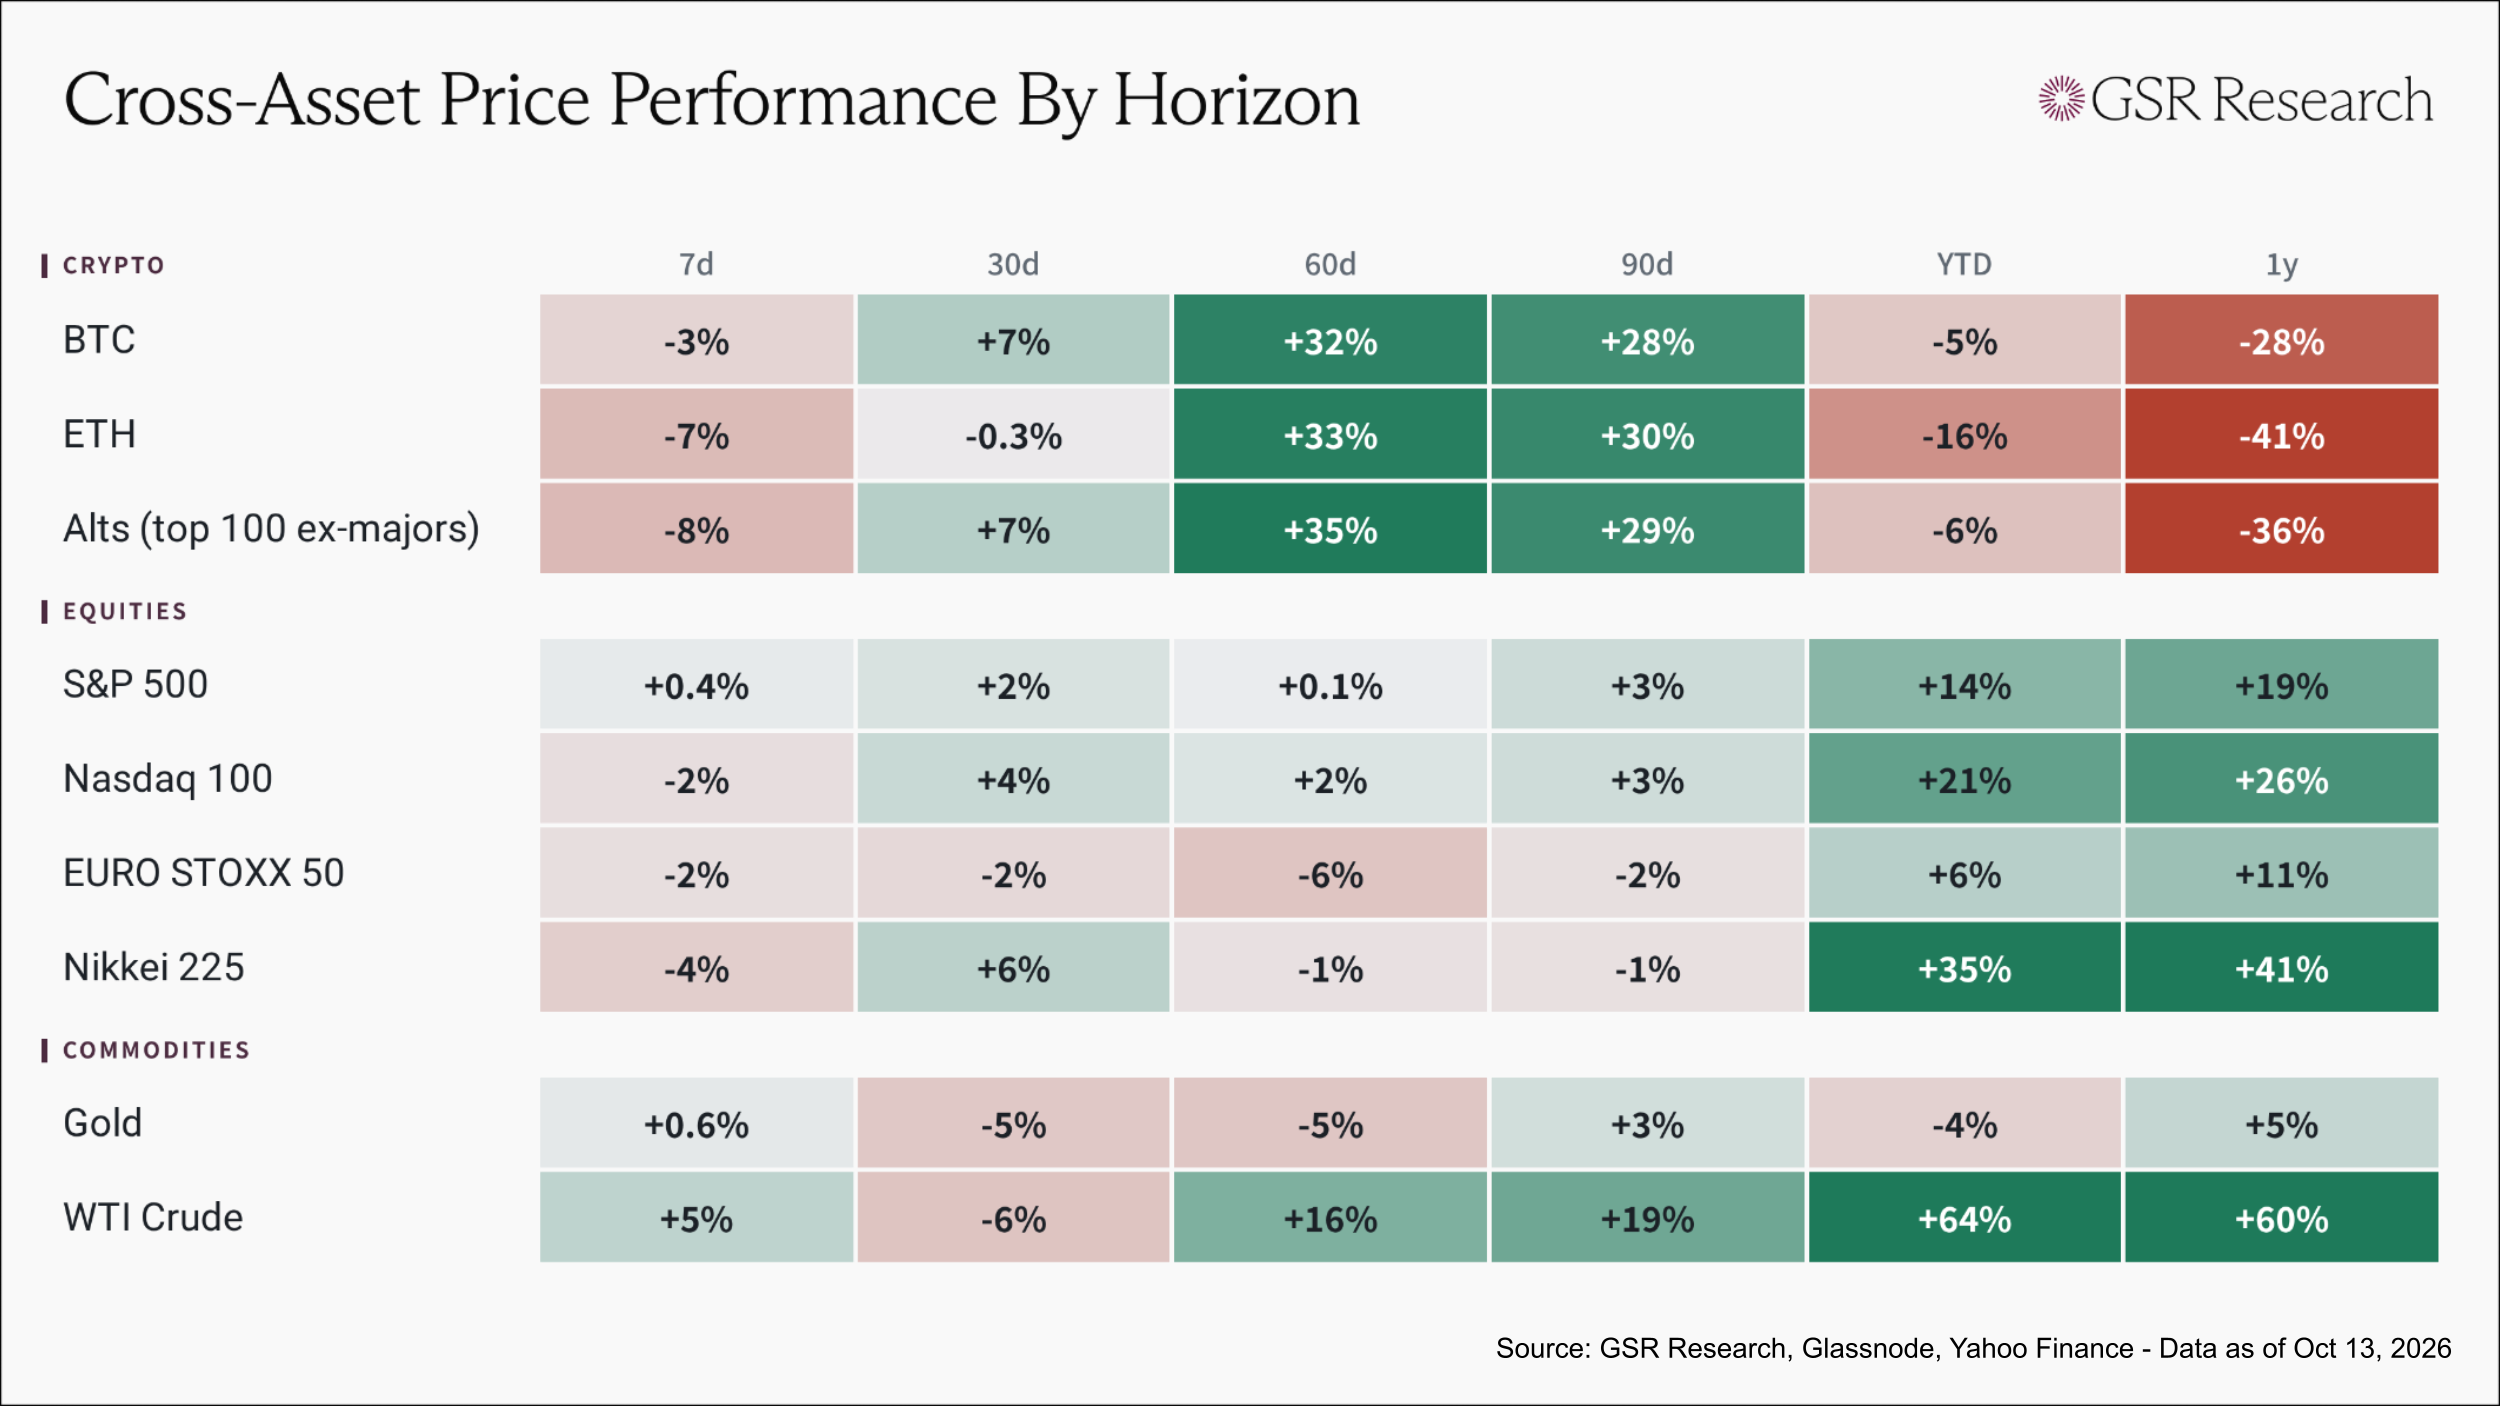
Crypto has been the best-performing asset class over the past two and three months, with BTC, ETH, and the alt basket up between +28% and +35% over both 60 and 90 days, well ahead of WTI crude, the next best at +16% and +19%. The recovery dates back to BTC's July 1 low of $58,566 and gathered pace in mid-August, when the Treasury's expanded buyback program pulled yields lower, with spot Bitcoin ETF flows for 2026 turning positive again in late September. However, crypto is the only asset class still down over the one year timeframe, with BTC -28%, ETH -41%, and the alt basket -36%, as the 1y column still measures from mid-October 2025, a week after BTC's all-time high of $126,080 and days after the October 10 liquidation event. Over the same year, equities rose, driven in large part by the AI trade, with the Nikkei 225 (+41%) and Nasdaq 100 (+26%) leading, and WTI crude gained +60% on the Iran conflict and disruptions to shipping through the Strait of Hormuz. Gold has held a +5% gain over the year despite falling over the past two months as yields climbed.
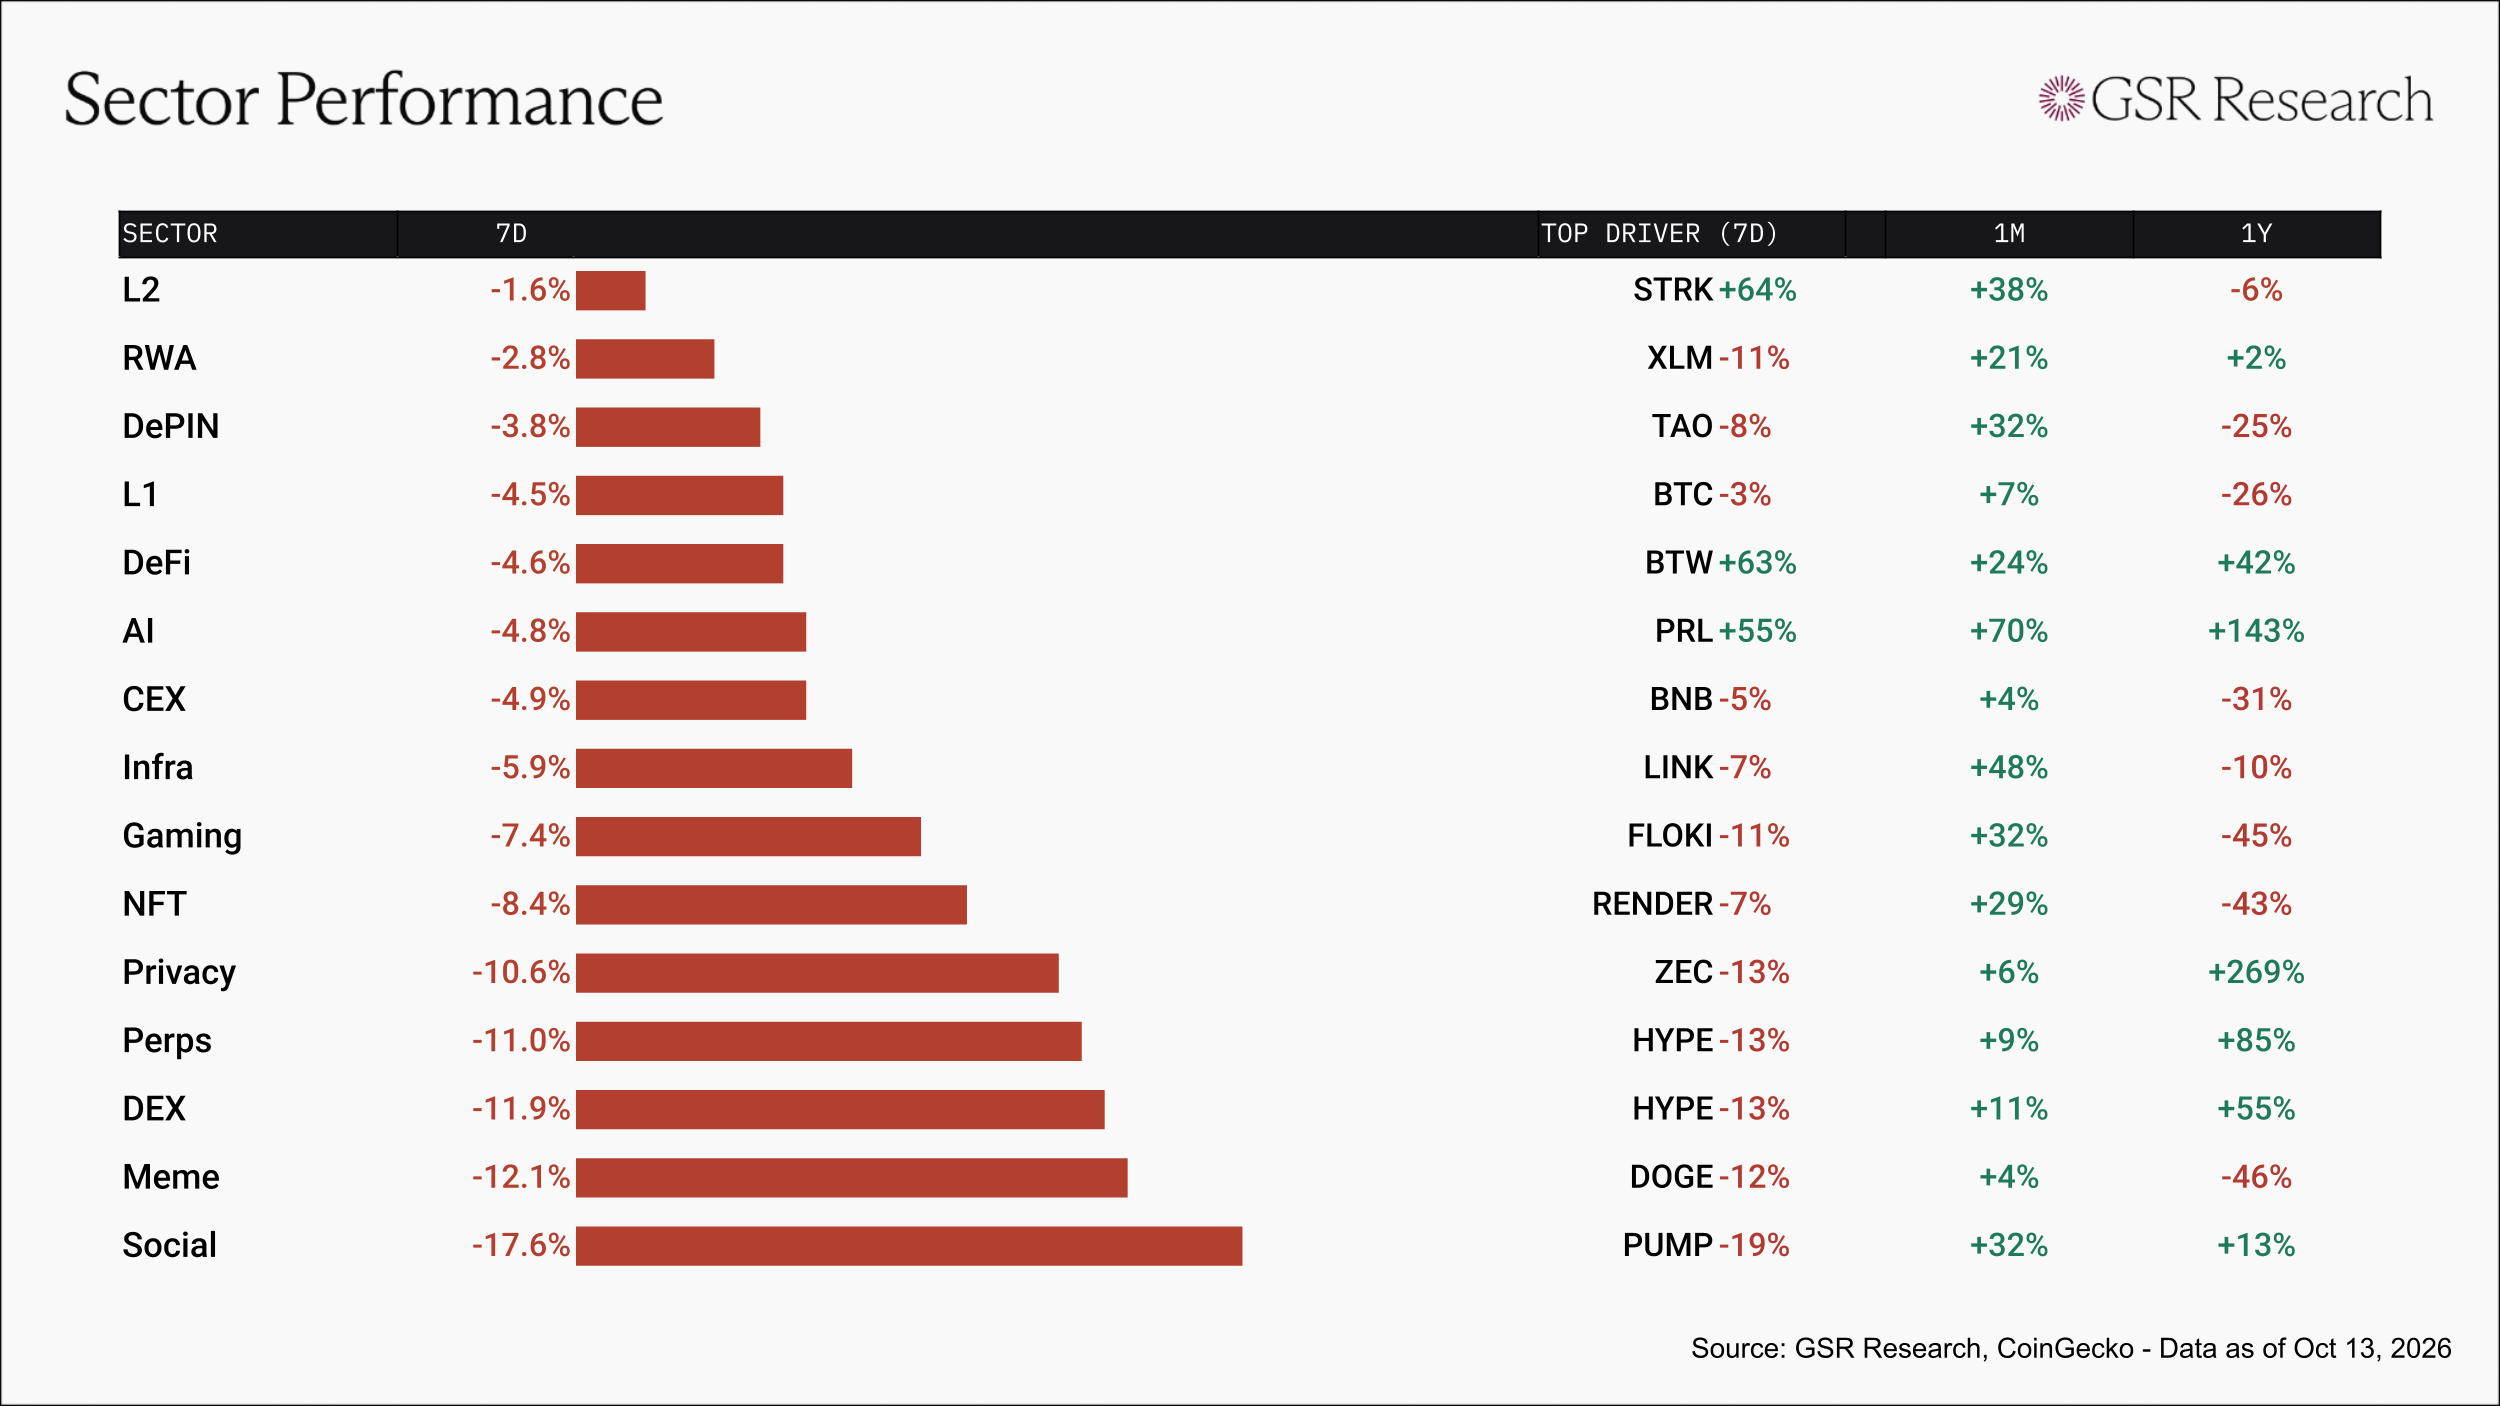
All 15 sectors closed red this week, with L2 falling least at -1.6% as STRK (+64%) rallied, largely after Starknet said on Thursday that it is actively considering becoming an independent Layer 1, with a target of full quantum resistance by 2027. RWA (-2.8%) and DePIN (-3.8%) held up despite XLM (-11%) and TAO (-8%), and DeFi (-4.6%) fell less than DEX and Perps as BTW (+63%) offset part of HYPE's decline. Most of the rest of the board fell 4.5% to 5.9%, with L1 (-4.5%) tracking BTC, CEX (-4.9%) following BNB (-5%), AI (-4.8%) in the middle, and Infra (-5.9%) carrying LINK (-7%).
Social fell furthest at -17.6% as PUMP (-19%) gave back most of last week's +28% gain, and Meme (-12.1%) followed DOGE (-12%). DEX (-11.9%) and Perps (-11.0%) fell with HYPE (-13%) in the week of its October 6 team unlock, a committed 3.75M HYPE ($336.75M) that the team said would go to a single institutional buyer over the counter. Privacy (-10.6%) slid as ZEC (-13%) extended last week's decline, while NFT (-8.4%) and Gaming (-7.4%) followed RENDER (-7%) and FLOKI (-11%).
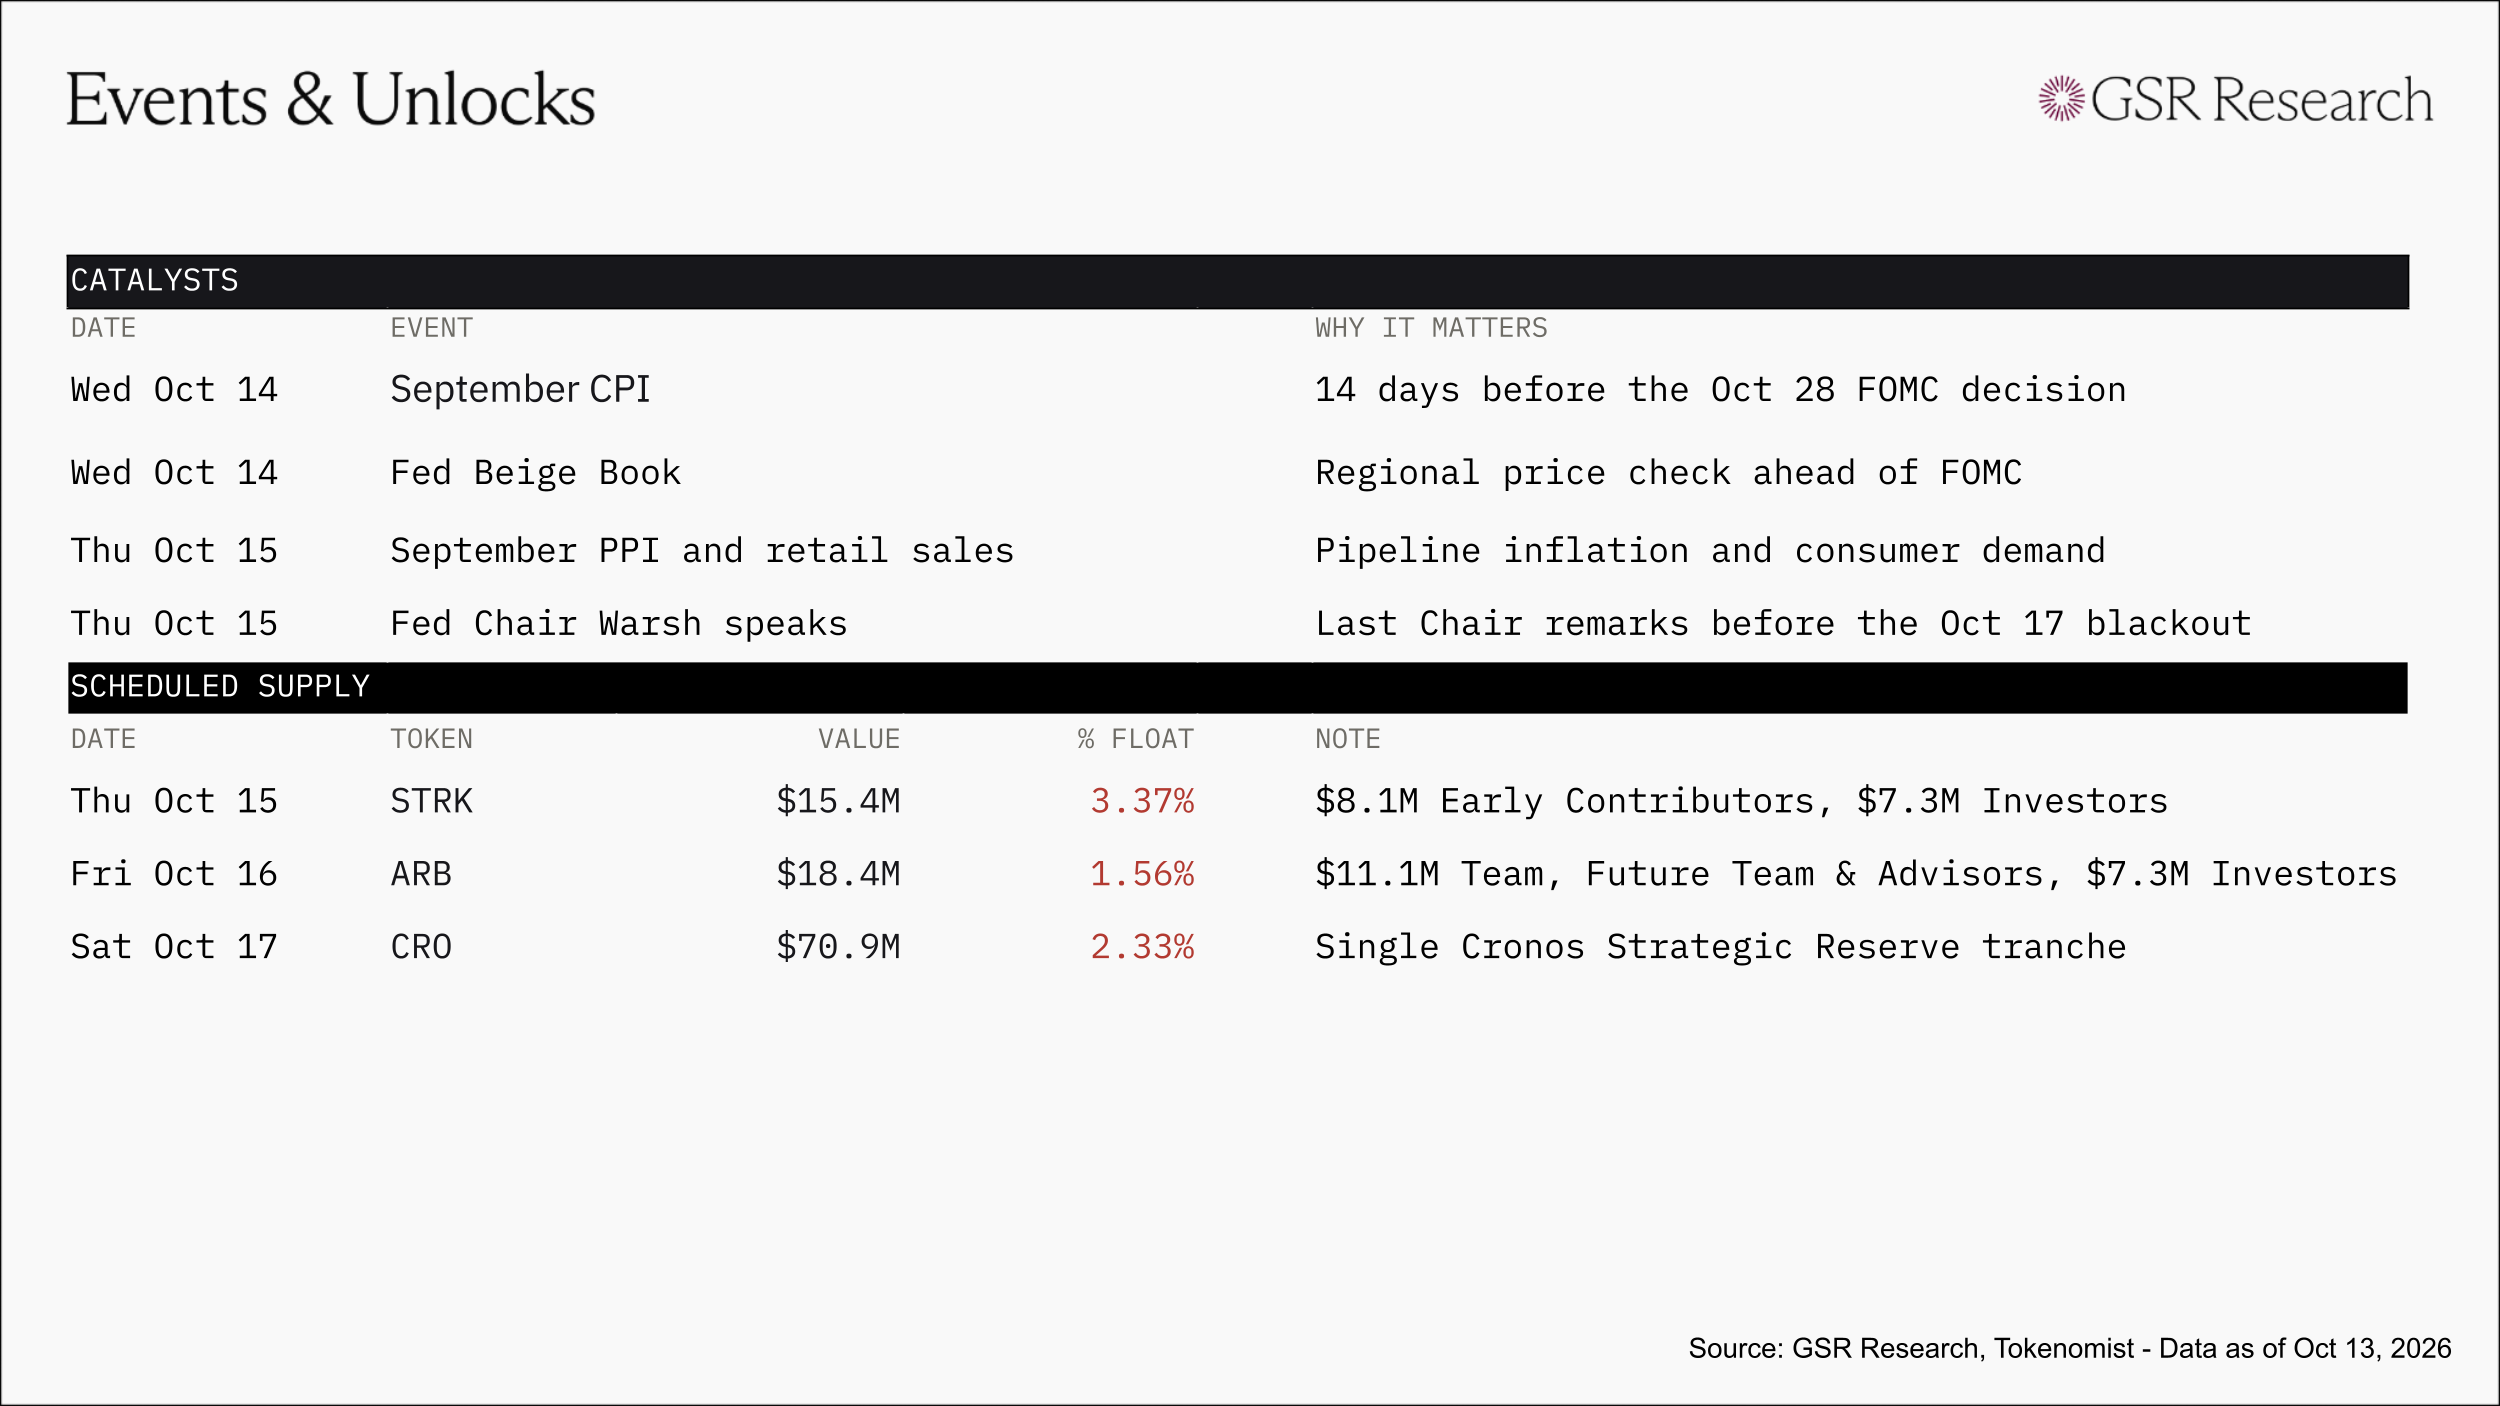
Data appendix. Each Market Pulse tile shows where a gauge sits in its own trailing one-year range: the bar runs from the year's low to its high, the dark marker is this week's reading, and the colored span behind it is the week's move, green when the gauge climbed its range and red when it fell. Tags mark position in that range: HIGH above the 65th percentile, LOW below the 35th, NEUTRAL between, with the tag's color carrying the read. Funding is BTC perpetual funding, OI-weighted across major venues and annualized; onchain yield is Aave v3's USDC market on Ethereum; stablecoin flows is the 7-day net change in supply of all USD-pegged stablecoins across all chains per DeFiLlama; open interest sums futures in the twelve largest futures assets (roughly 95% of all crypto futures OI) against total crypto market cap; ETF flows combines US spot Bitcoin and Ethereum funds on a rolling 7 days; and altcoins is the share of the top 100, excluding stablecoins and wrappers, beating BTC over 7 days. Sector returns are cap-weighted CoinGecko categories, top ten constituents each. Sources: GSR Research, Glassnode, Deribit, CoinGecko, DeFiLlama, FRED, Tokenomist.
This material is provided by GSR (the “Firm”) solely for informational purposes. It is not intended to be advice or a recommendation to buy, sell or hold any investment mentioned. Investors should form their own views in relation to any proposed investment.
It is intended only for sophisticated, institutional investors and does not constitute an offer or commitment, a solicitation of an offer or commitment, or any advice or recommendation, to enter into or conclude any transaction (whether on the terms shown or otherwise), or to provide investment services in any state or country where such an offer or solicitation or provision would be illegal. The Firm is not and does not act as an advisor or fiduciary in providing this material.
This material is not an independent research report, and has not been prepared in accordance with any legal requirements by any regulator (including the FCA, FINRA or CFTC) designed to promote the independence of investment research.
This material is not independent of the Firm’s proprietary interests, which may conflict with the interests of any counterparty of the Firm. The Firm may trade investments discussed in this material for its own account, may trade contrary to the views expressed in this material, and may have positions in other related instruments. The Firm is not subject to any prohibition on dealing ahead of the dissemination of this material.
Information contained herein is based on sources considered to be reliable, but is not guaranteed to be accurate or complete. Any opinions or estimates expressed herein reflect a judgment made by the author(s) as of the date of publication, and are subject to change without notice. The Firm does not plan to update this information.
Trading and investing in digital assets involves significant risks including price volatility and illiquidity and may not be suitable for all investors. The Firm is not liable whatsoever for any direct or consequential loss arising from the use of this material. Copyright of this material belongs to GSR. Neither this material nor any copy thereof may be taken, reproduced or redistributed, directly or indirectly, without prior written permission of GSR.
Please see here for additional Regulatory Legal Notices relevant to US, UK and Singapore.