GSR Weekly - September 28, 2026

Carlos Guzman
Research Analyst

Slater Santer
Research Analyst

Carlos Guzman
Research Analyst
Slater Santer
Research Analyst
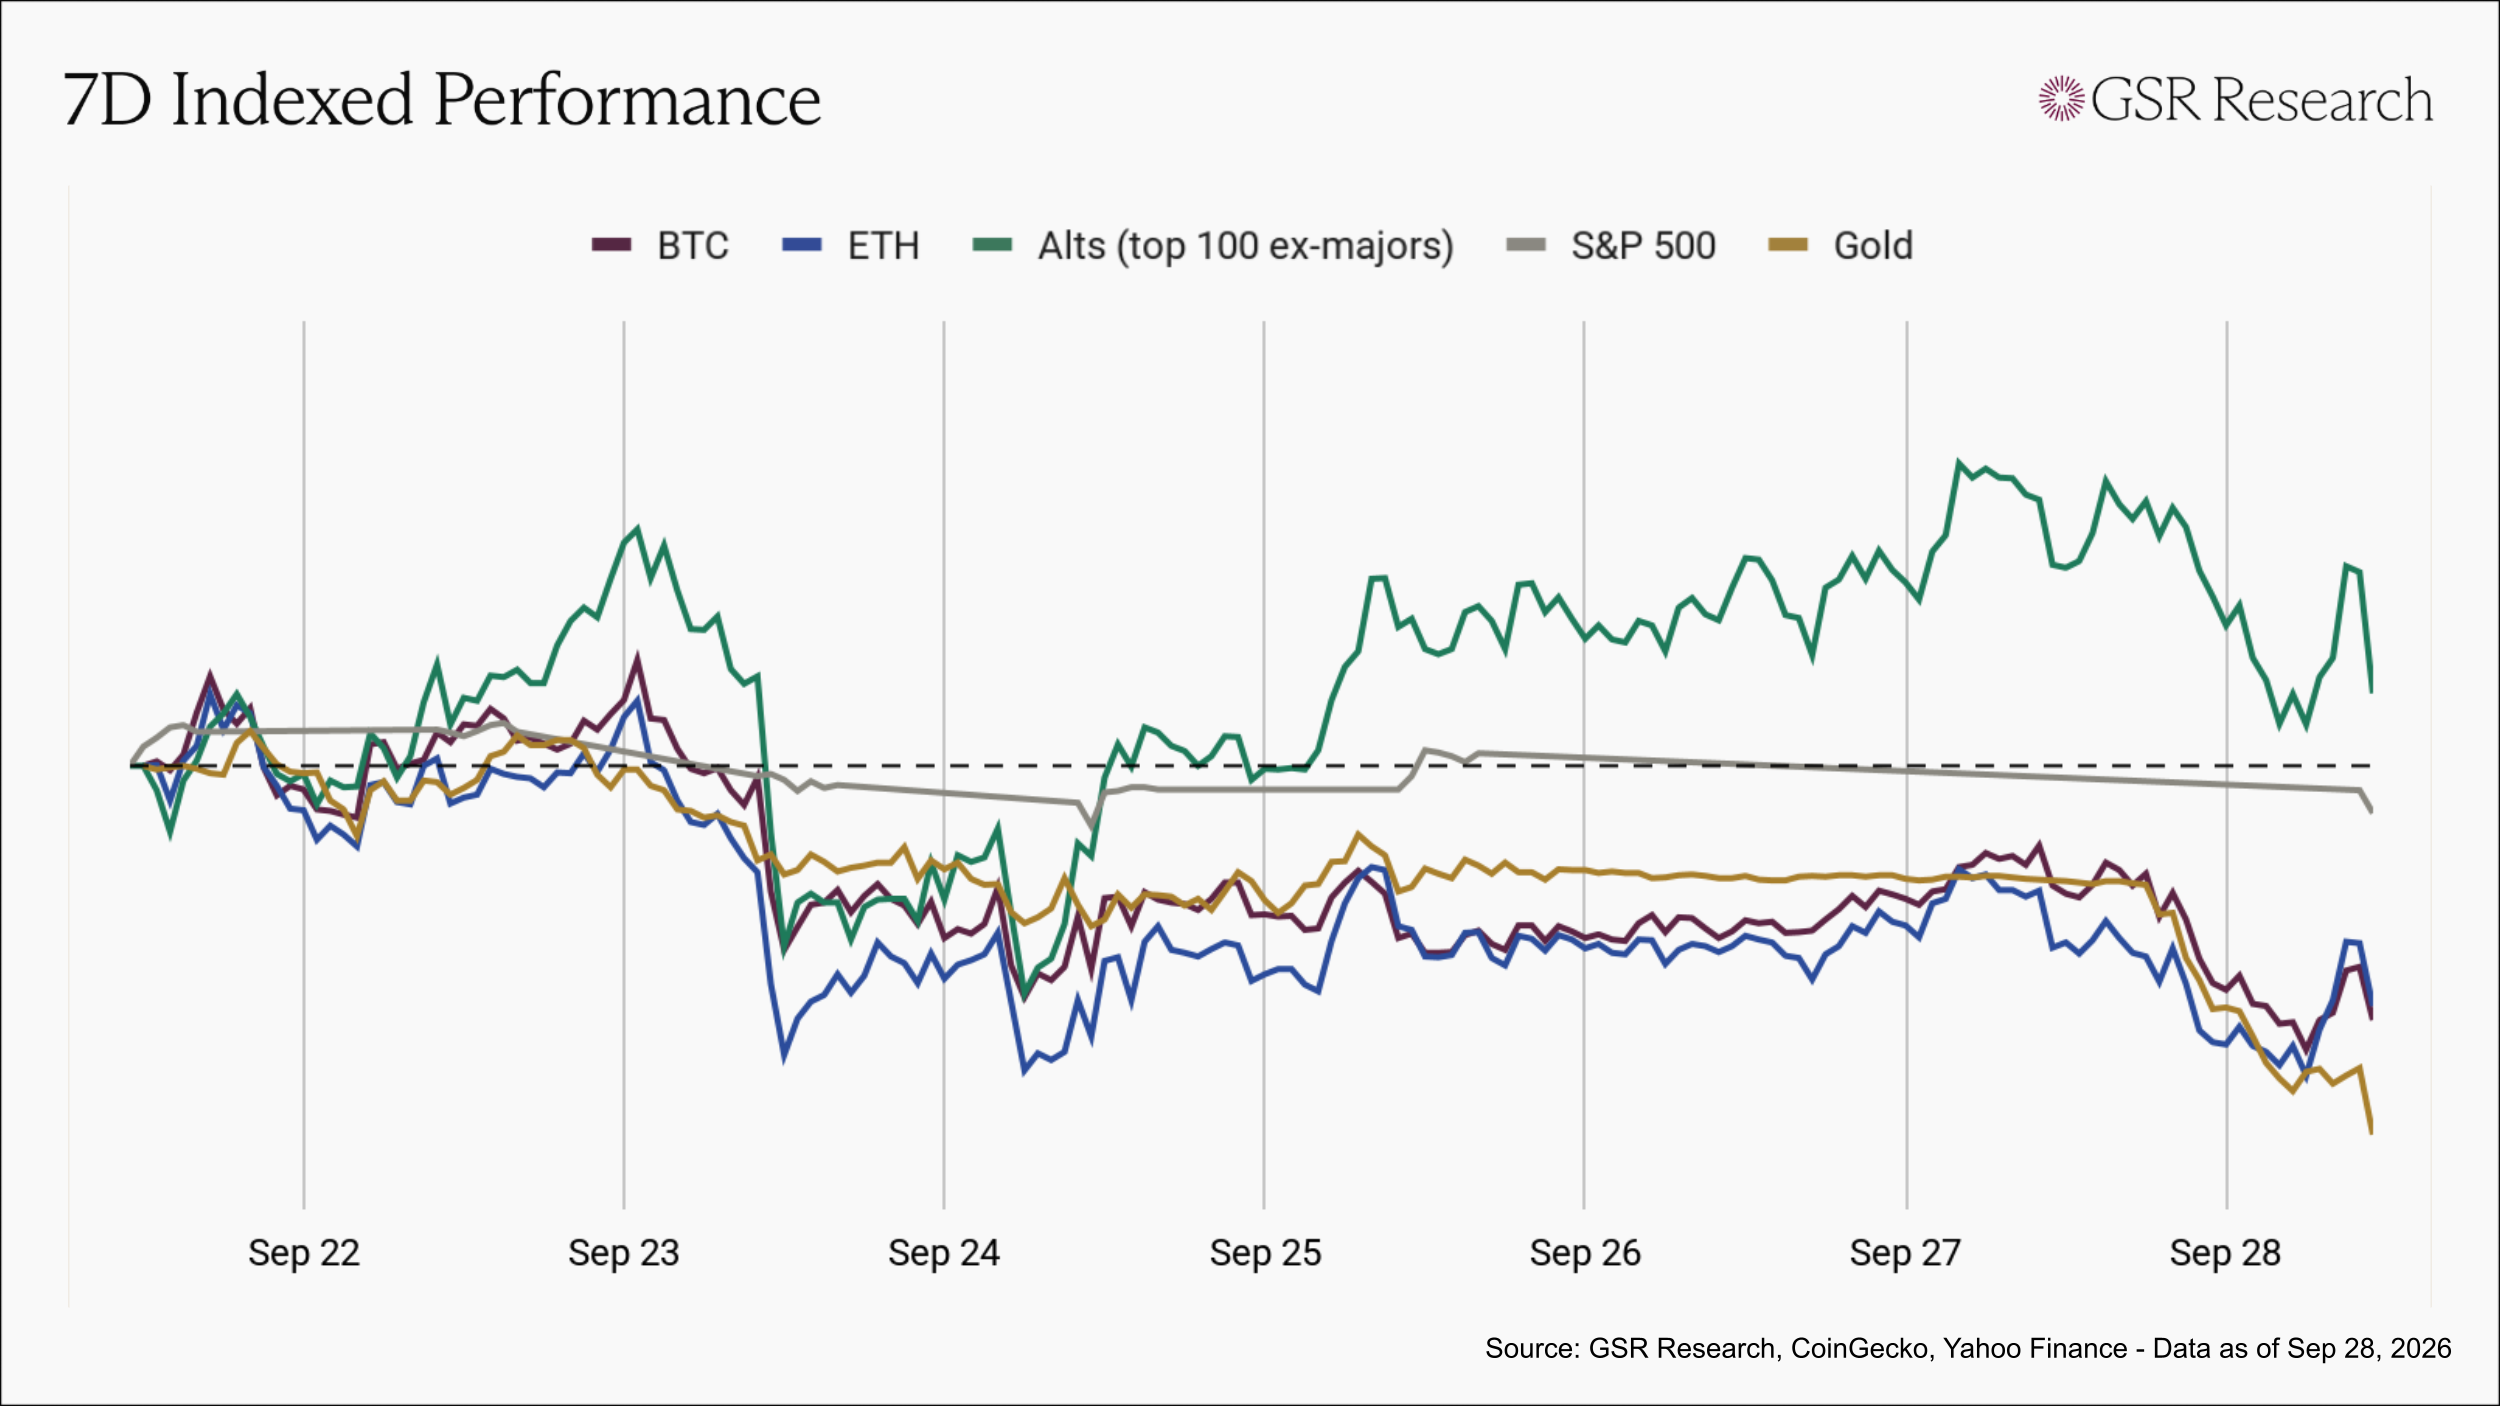
This week’s rally faded from Tuesday's high as odds of another hike at the October 27-28 meeting climbed from 58% to 70% on CME FedWatch through a week of hawkish Fed commentary, with the dollar index reaching an eight-week high and BTC sitting ~5% below its Wednesday peak at Thursday's low of $82,557. Spot ETF demand held through the pullback, with $999M of inflows into Bitcoin funds on Monday and $2.4B over the week. Alts decoupled from Thursday, rallying ~10% to Sunday's high as QNT (+240%) and NEAR (+22%) squeezed while BTC sat flat. Today brought the week's sharpest move, as gold fell 3% to $4,156, its lowest since August 5, after Brent climbed toward $108 on Tehran's refusal to soften its demands for reopening the Strait of Hormuz, and BTC fell 2.7% to $82,780 with roughly $500M liquidated market-wide. BTC finished down ~3% at $84k, ETH ~2% lower, alts up ~3%, gold down ~6%, and the S&P ~1% lower.
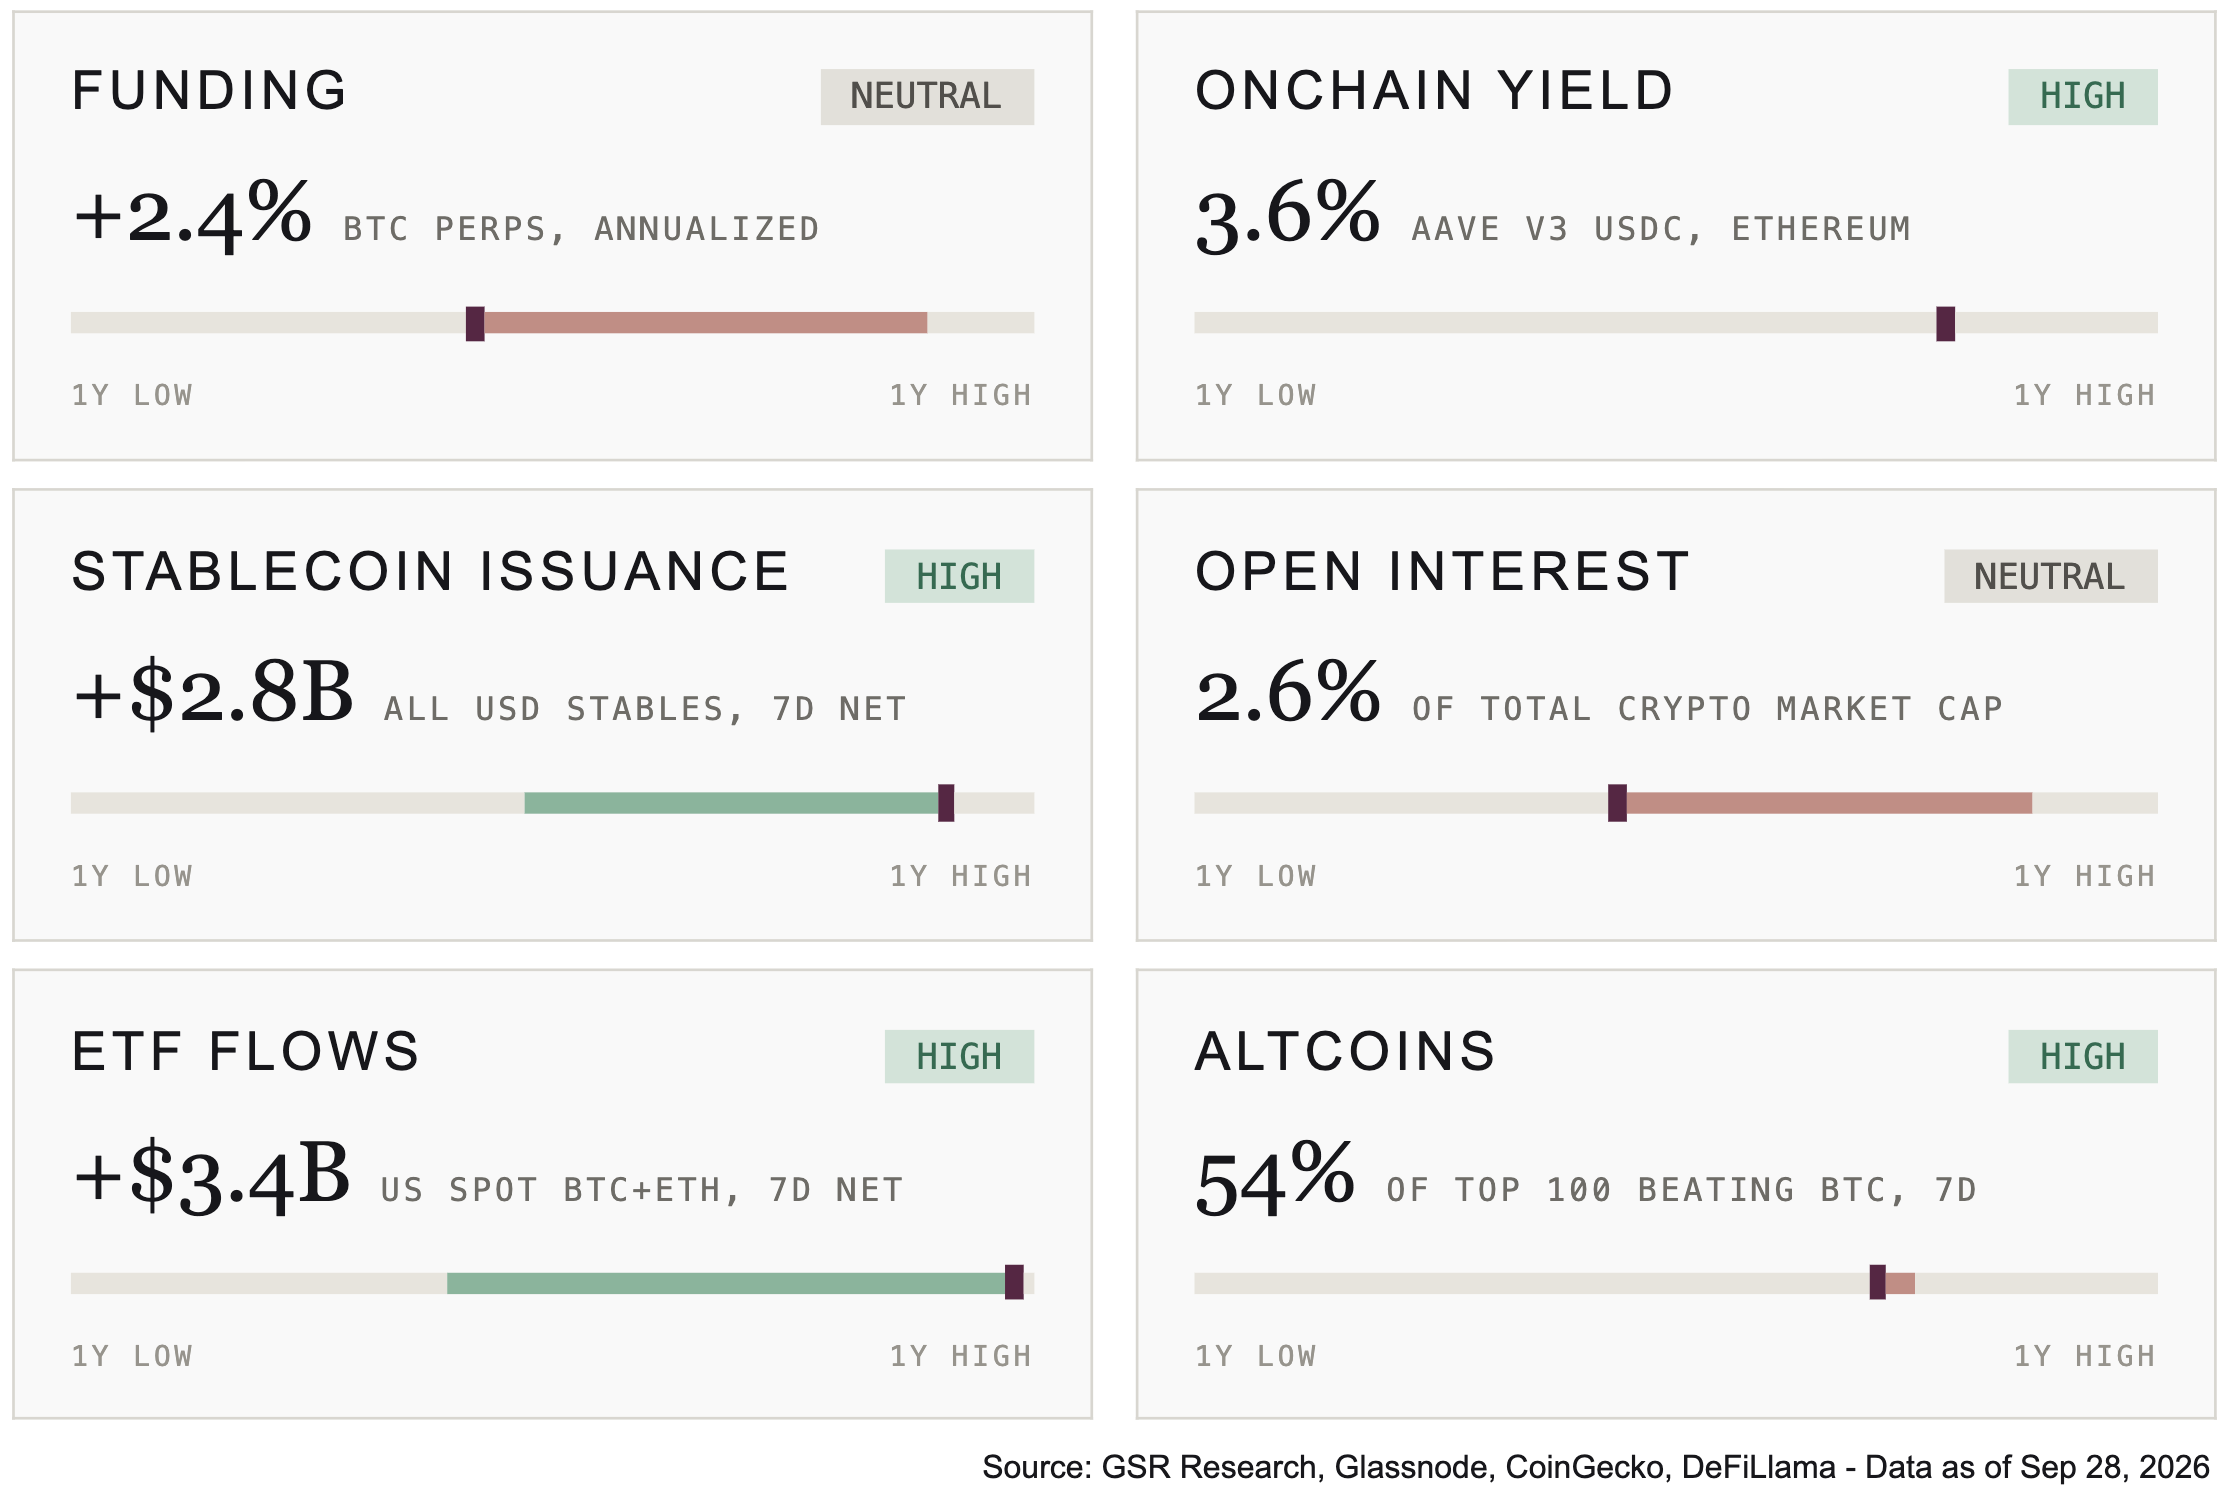
ETF flows swung from -$0.4B to +$3.4B, the largest weekly inflow in 2026, and stablecoin issuance jumped from +$0.1B to +$2.8B, both near one-year highs. Funding fell from +7.5% to +2.4% annualized, back to neutral, and open interest ticked down from 2.7% to 2.6% of total market cap, with onchain yield consistent at 3.6%. Altcoin performance held at 54 of the top 100 beating Bitcoin, down 2 from the week prior. External flows arrived in size while funding and open interest came down.
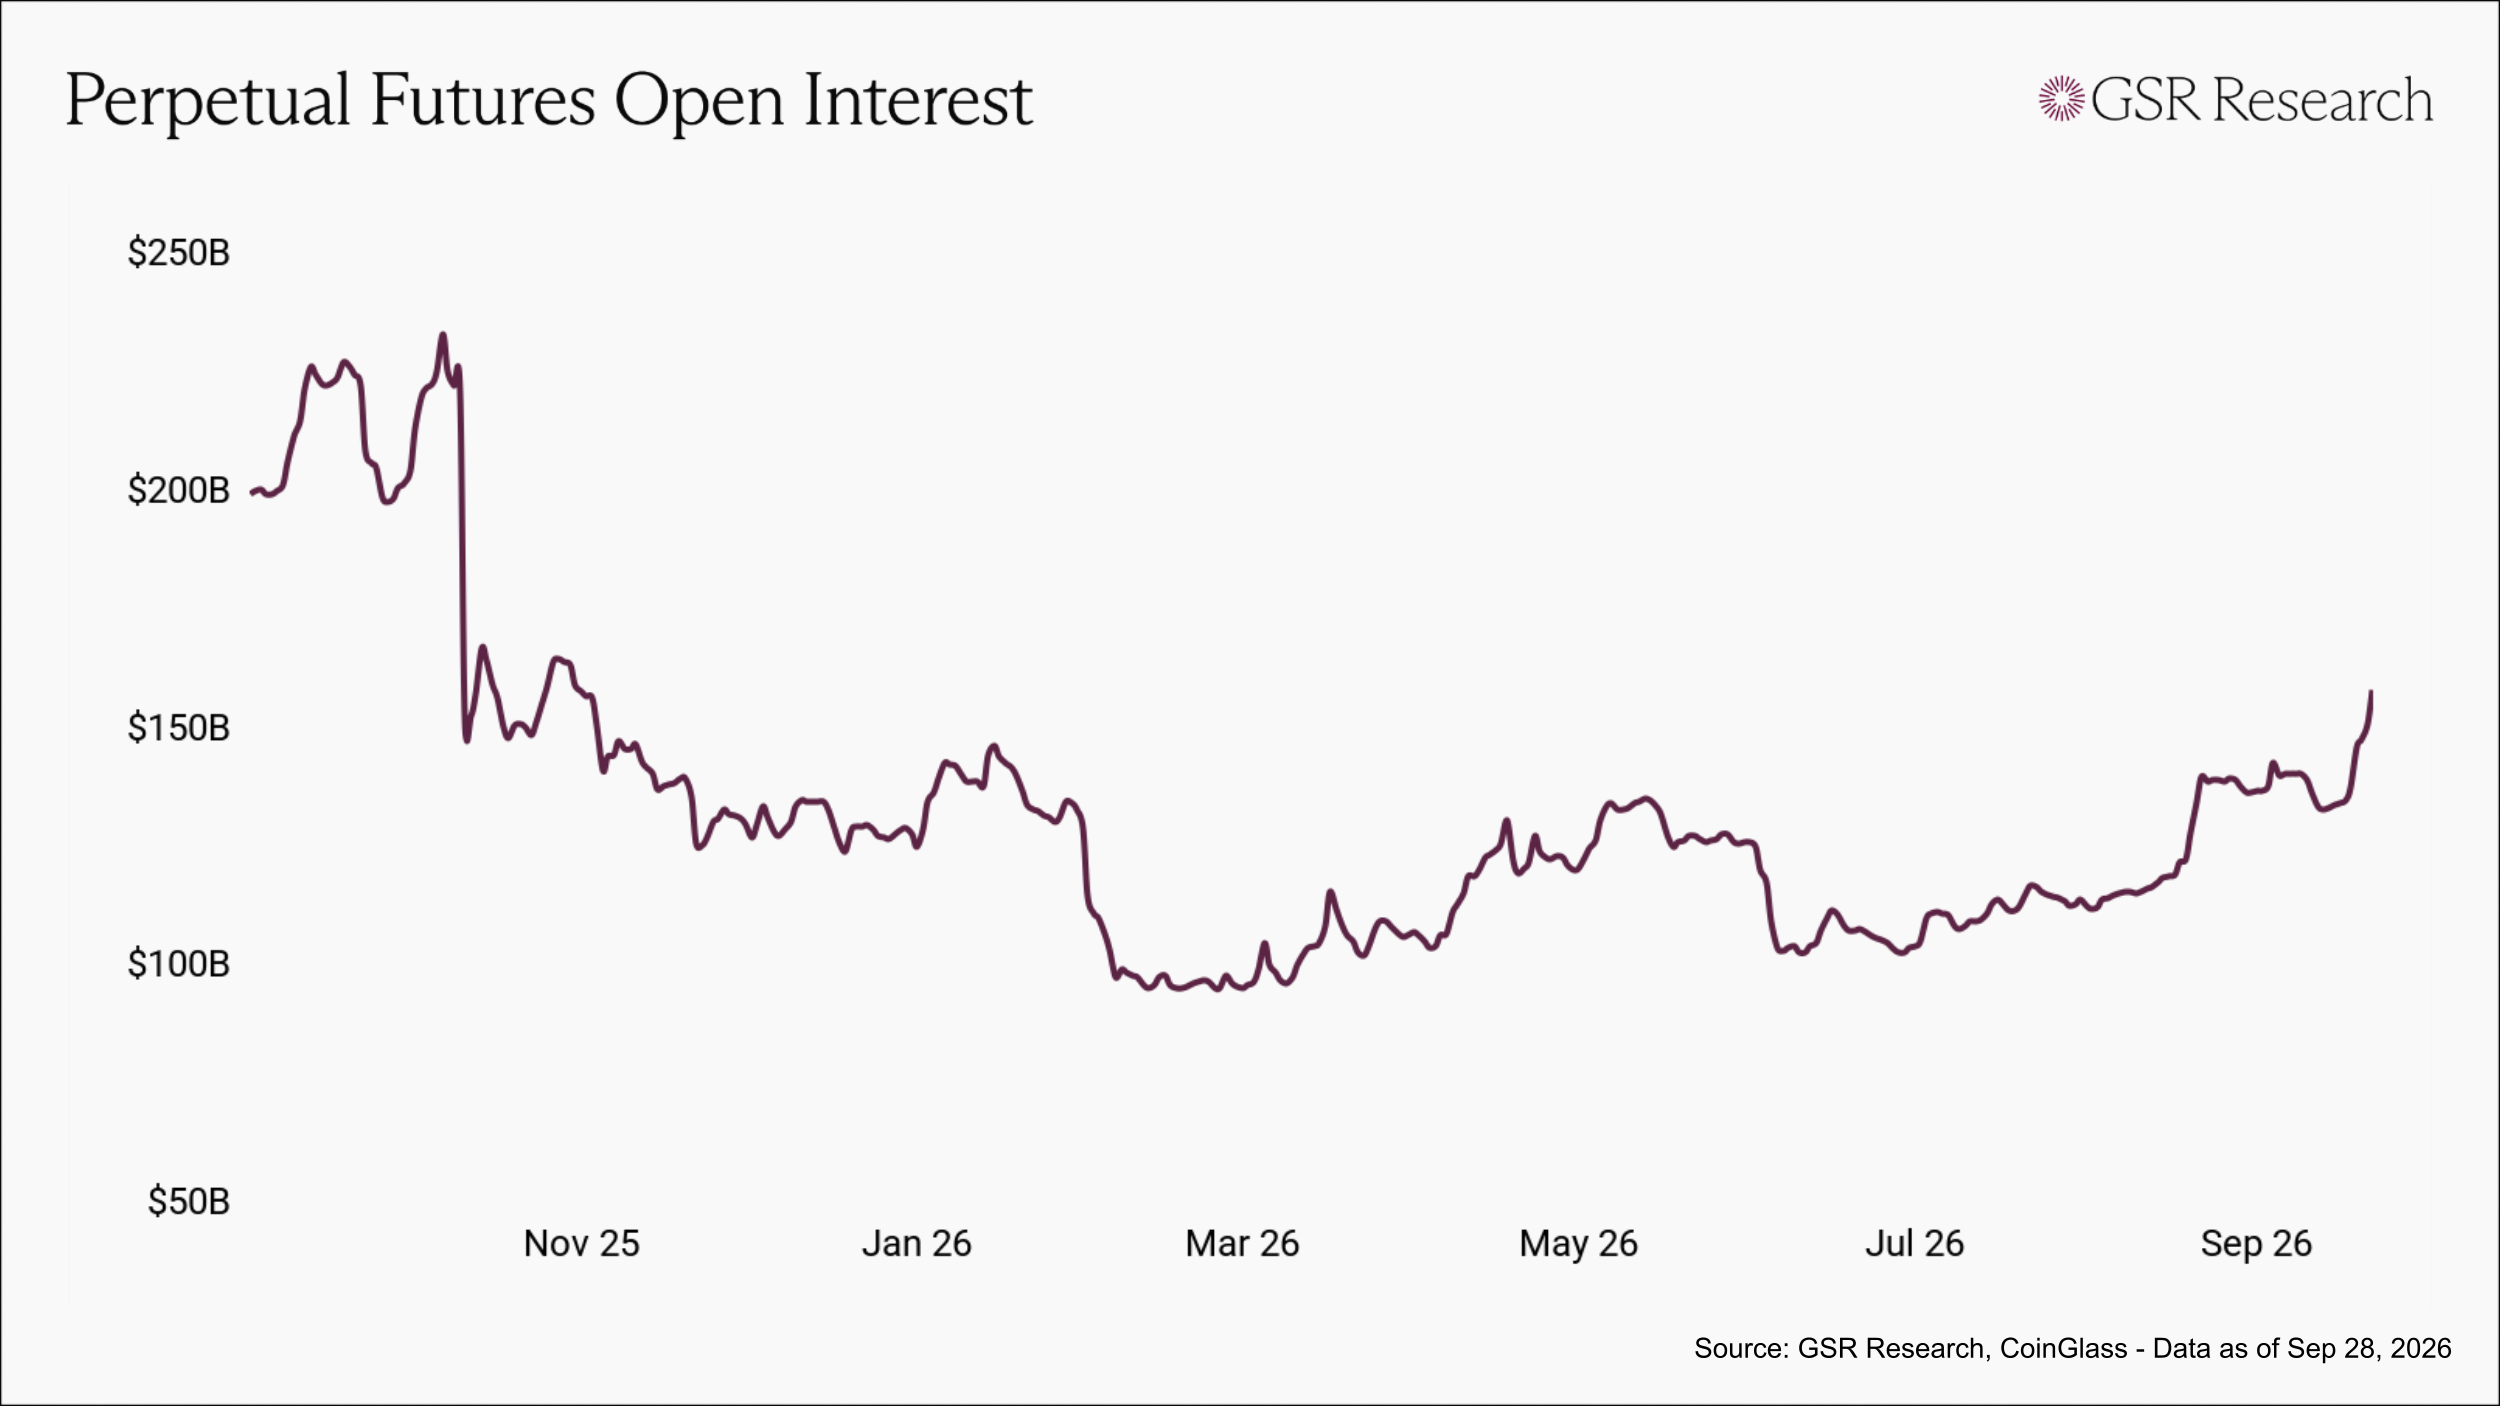
Crypto perpetual open interest reached an 11-month high near $155B this week per Coinglass, up from a low near $90B in February and the highest since the weeks following October 10 last year, when a $19B liquidation cascade cut open interest from roughly $220B to $150B in a single session. Despite the rise in OI, the market is not yet close to the levels of leverage seen around October 10 of last year, relative to the aggregate market cap of crypto assets. Our Market Pulse OI gauge, which weighs futures against total market cap, actually fell from 2.7% to 2.6% this week, well below the top of a one-year range that includes the run-up to 10/10. Positioning also looks less one-sided, with funding falling from +7.5% to +2.4% annualized even as dollar open interest rose against last October, when $16.7B of the $19.1B liquidated was longs. Our measures show that leverage relative to market size sits in the middle of its one-year range.
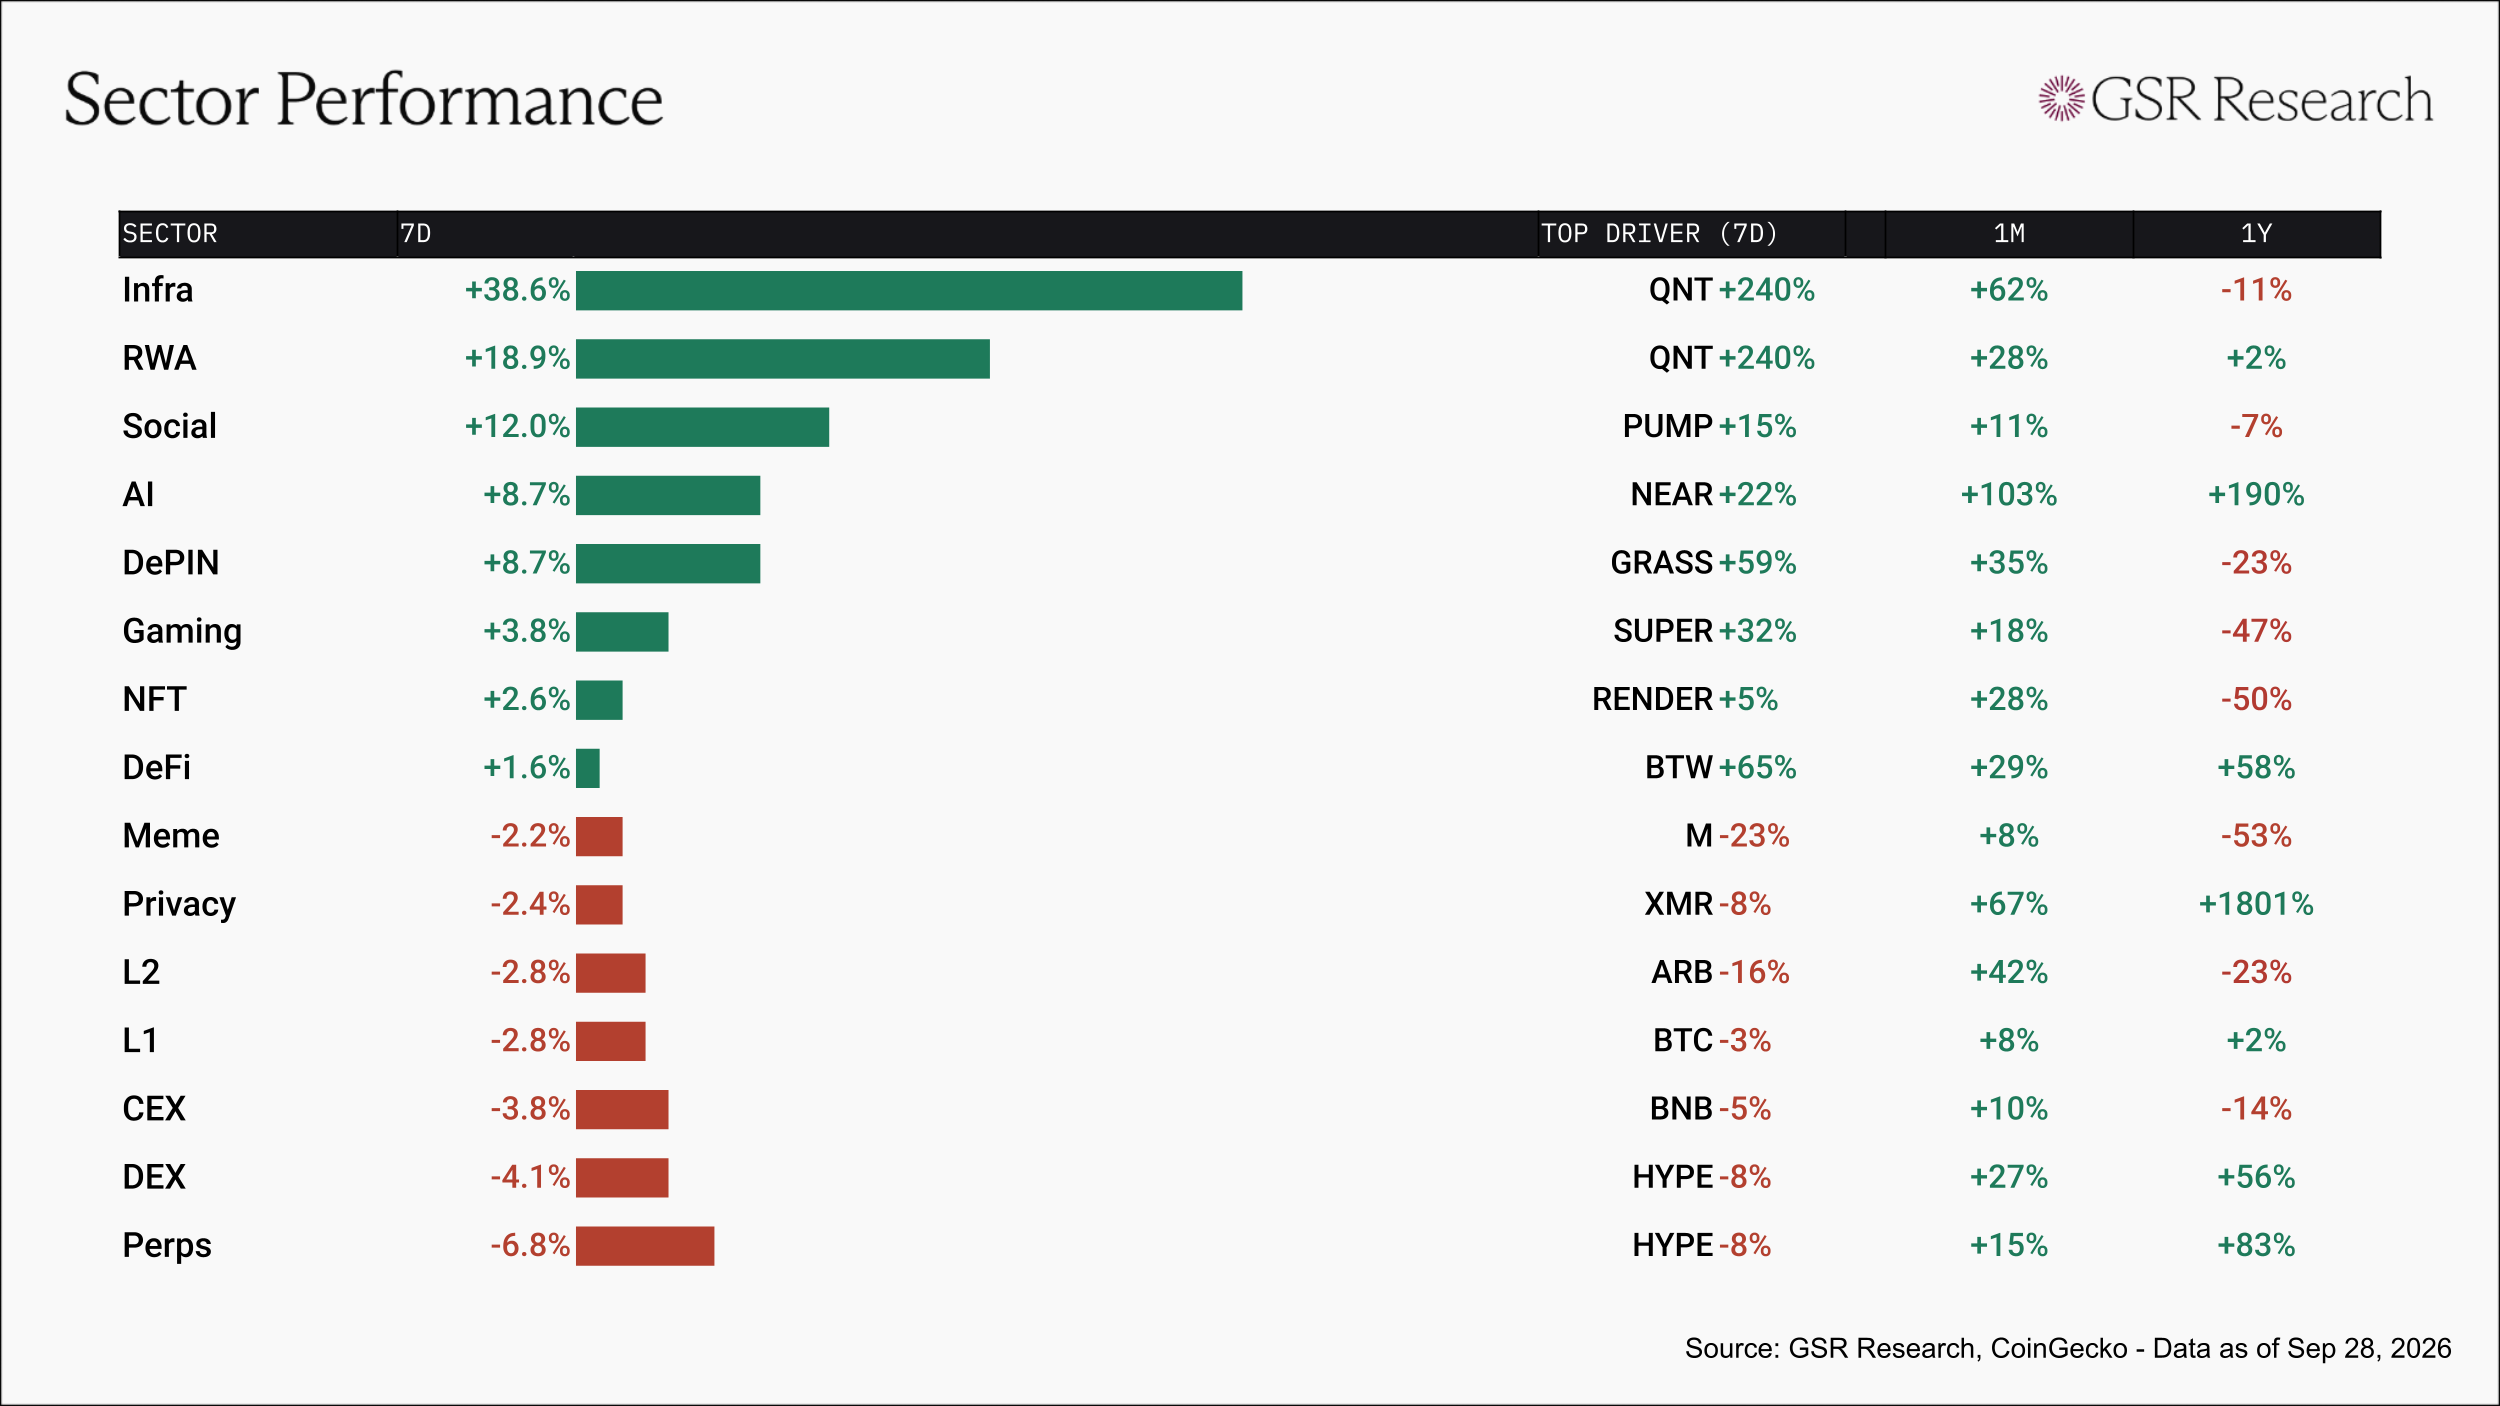
Eight of 15 sectors closed green this week, with most of the gains concentrated in a single name. Infra (+38.6%) and RWA (+18.9%) both rode QNT (+240%) after The Clearing House said on Wednesday it had chosen Quant to power its On-Chain Money Initiative, a tokenized deposit clearing and settlement network. Social (+12.0%) rose on PUMP (+15%), and AI (+8.7%) and DePIN (+8.7%) extended on NEAR (+22%) and GRASS (+59%), leaving AI up +103% on the month.
Perps (-6.8%) and DEX (-4.1%) fell with HYPE (-8%), CEX (-3.8%) followed BNB (-5%), and L1 (-2.8%) tracked BTC (-3%). L2 (-2.8%) gave back part of ARB's run as the token fell 16%, and Privacy (-2.4%) slipped on XMR (-8%) while ZEC held above $1,500, leaving the sector up +67% on the month. XPL fell 5% through Friday's token unlock, after a team and investors cliff increased circulating supply by 63%.
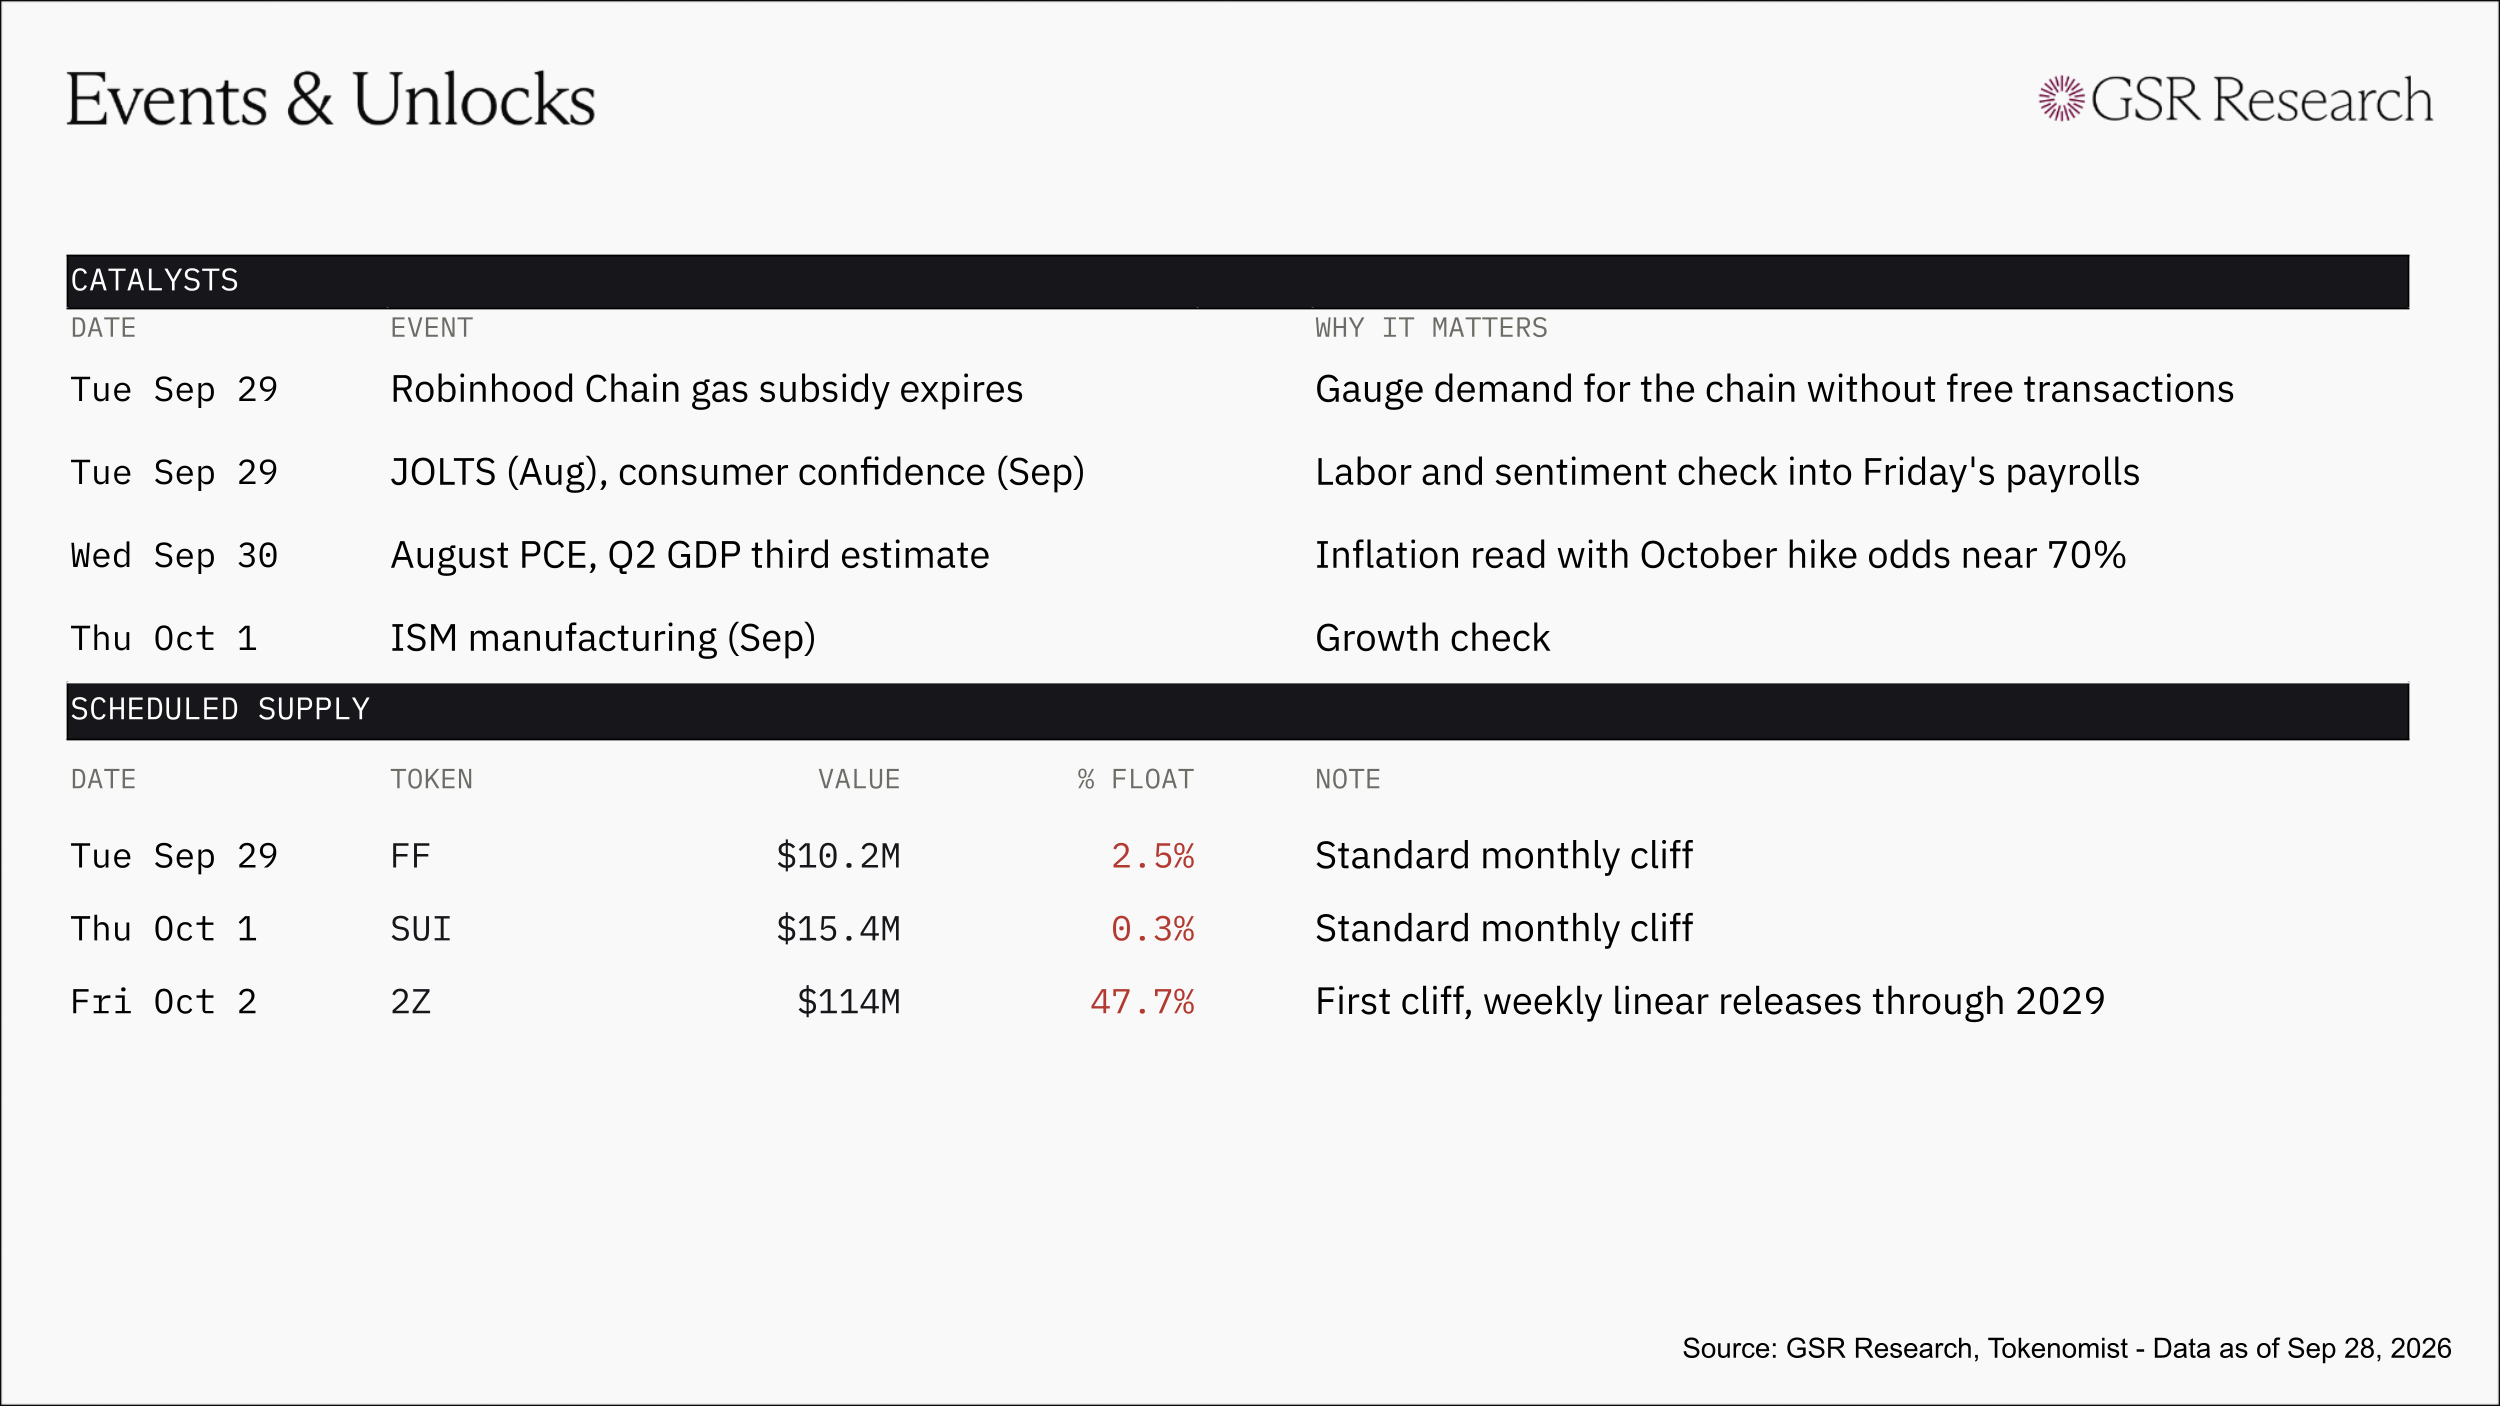
Data appendix. Each Market Pulse tile shows where a gauge sits in its own trailing one-year range: the bar runs from the year's low to its high, the dark marker is this week's reading, and the colored span behind it is the week's move, green when the gauge climbed its range and red when it fell. Tags mark position in that range: HIGH above the 65th percentile, LOW below the 35th, NEUTRAL between, with the tag's color carrying the read. Funding is BTC perpetual funding, OI-weighted across major venues and annualized; onchain yield is Aave v3's USDC market on Ethereum; stablecoin flows is the 7-day net change in supply of all USD-pegged stablecoins across all chains per DeFiLlama; open interest sums futures in the twelve largest futures assets (roughly 95% of all crypto futures OI) against total crypto market cap; ETF flows combines US spot Bitcoin and Ethereum funds on a rolling 7 days; and altcoins is the share of the top 100, excluding stablecoins and wrappers, beating BTC over 7 days. Sector returns are cap-weighted CoinGecko categories, top ten constituents each. Sources: GSR Research, Glassnode, Deribit, CoinGecko, DeFiLlama, FRED, Tokenomist.
This material is provided by GSR (the “Firm”) solely for informational purposes. It is not intended to be advice or a recommendation to buy, sell or hold any investment mentioned. Investors should form their own views in relation to any proposed investment.
It is intended only for sophisticated, institutional investors and does not constitute an offer or commitment, a solicitation of an offer or commitment, or any advice or recommendation, to enter into or conclude any transaction (whether on the terms shown or otherwise), or to provide investment services in any state or country where such an offer or solicitation or provision would be illegal. The Firm is not and does not act as an advisor or fiduciary in providing this material.
This material is not an independent research report, and has not been prepared in accordance with any legal requirements by any regulator (including the FCA, FINRA or CFTC) designed to promote the independence of investment research.
This material is not independent of the Firm’s proprietary interests, which may conflict with the interests of any counterparty of the Firm. The Firm may trade investments discussed in this material for its own account, may trade contrary to the views expressed in this material, and may have positions in other related instruments. The Firm is not subject to any prohibition on dealing ahead of the dissemination of this material.
Information contained herein is based on sources considered to be reliable, but is not guaranteed to be accurate or complete. Any opinions or estimates expressed herein reflect a judgment made by the author(s) as of the date of publication, and are subject to change without notice. The Firm does not plan to update this information.
Trading and investing in digital assets involves significant risks including price volatility and illiquidity and may not be suitable for all investors. The Firm is not liable whatsoever for any direct or consequential loss arising from the use of this material. Copyright of this material belongs to GSR. Neither this material nor any copy thereof may be taken, reproduced or redistributed, directly or indirectly, without prior written permission of GSR.
Please see here for additional Regulatory Legal Notices relevant to US, UK and Singapore.