GSR Weekly - November 9th, 2026

Carlos Guzman
Research Analyst

Slater Santer
Research Analyst

Carlos Guzman
Research Analyst
Slater Santer
Research Analyst
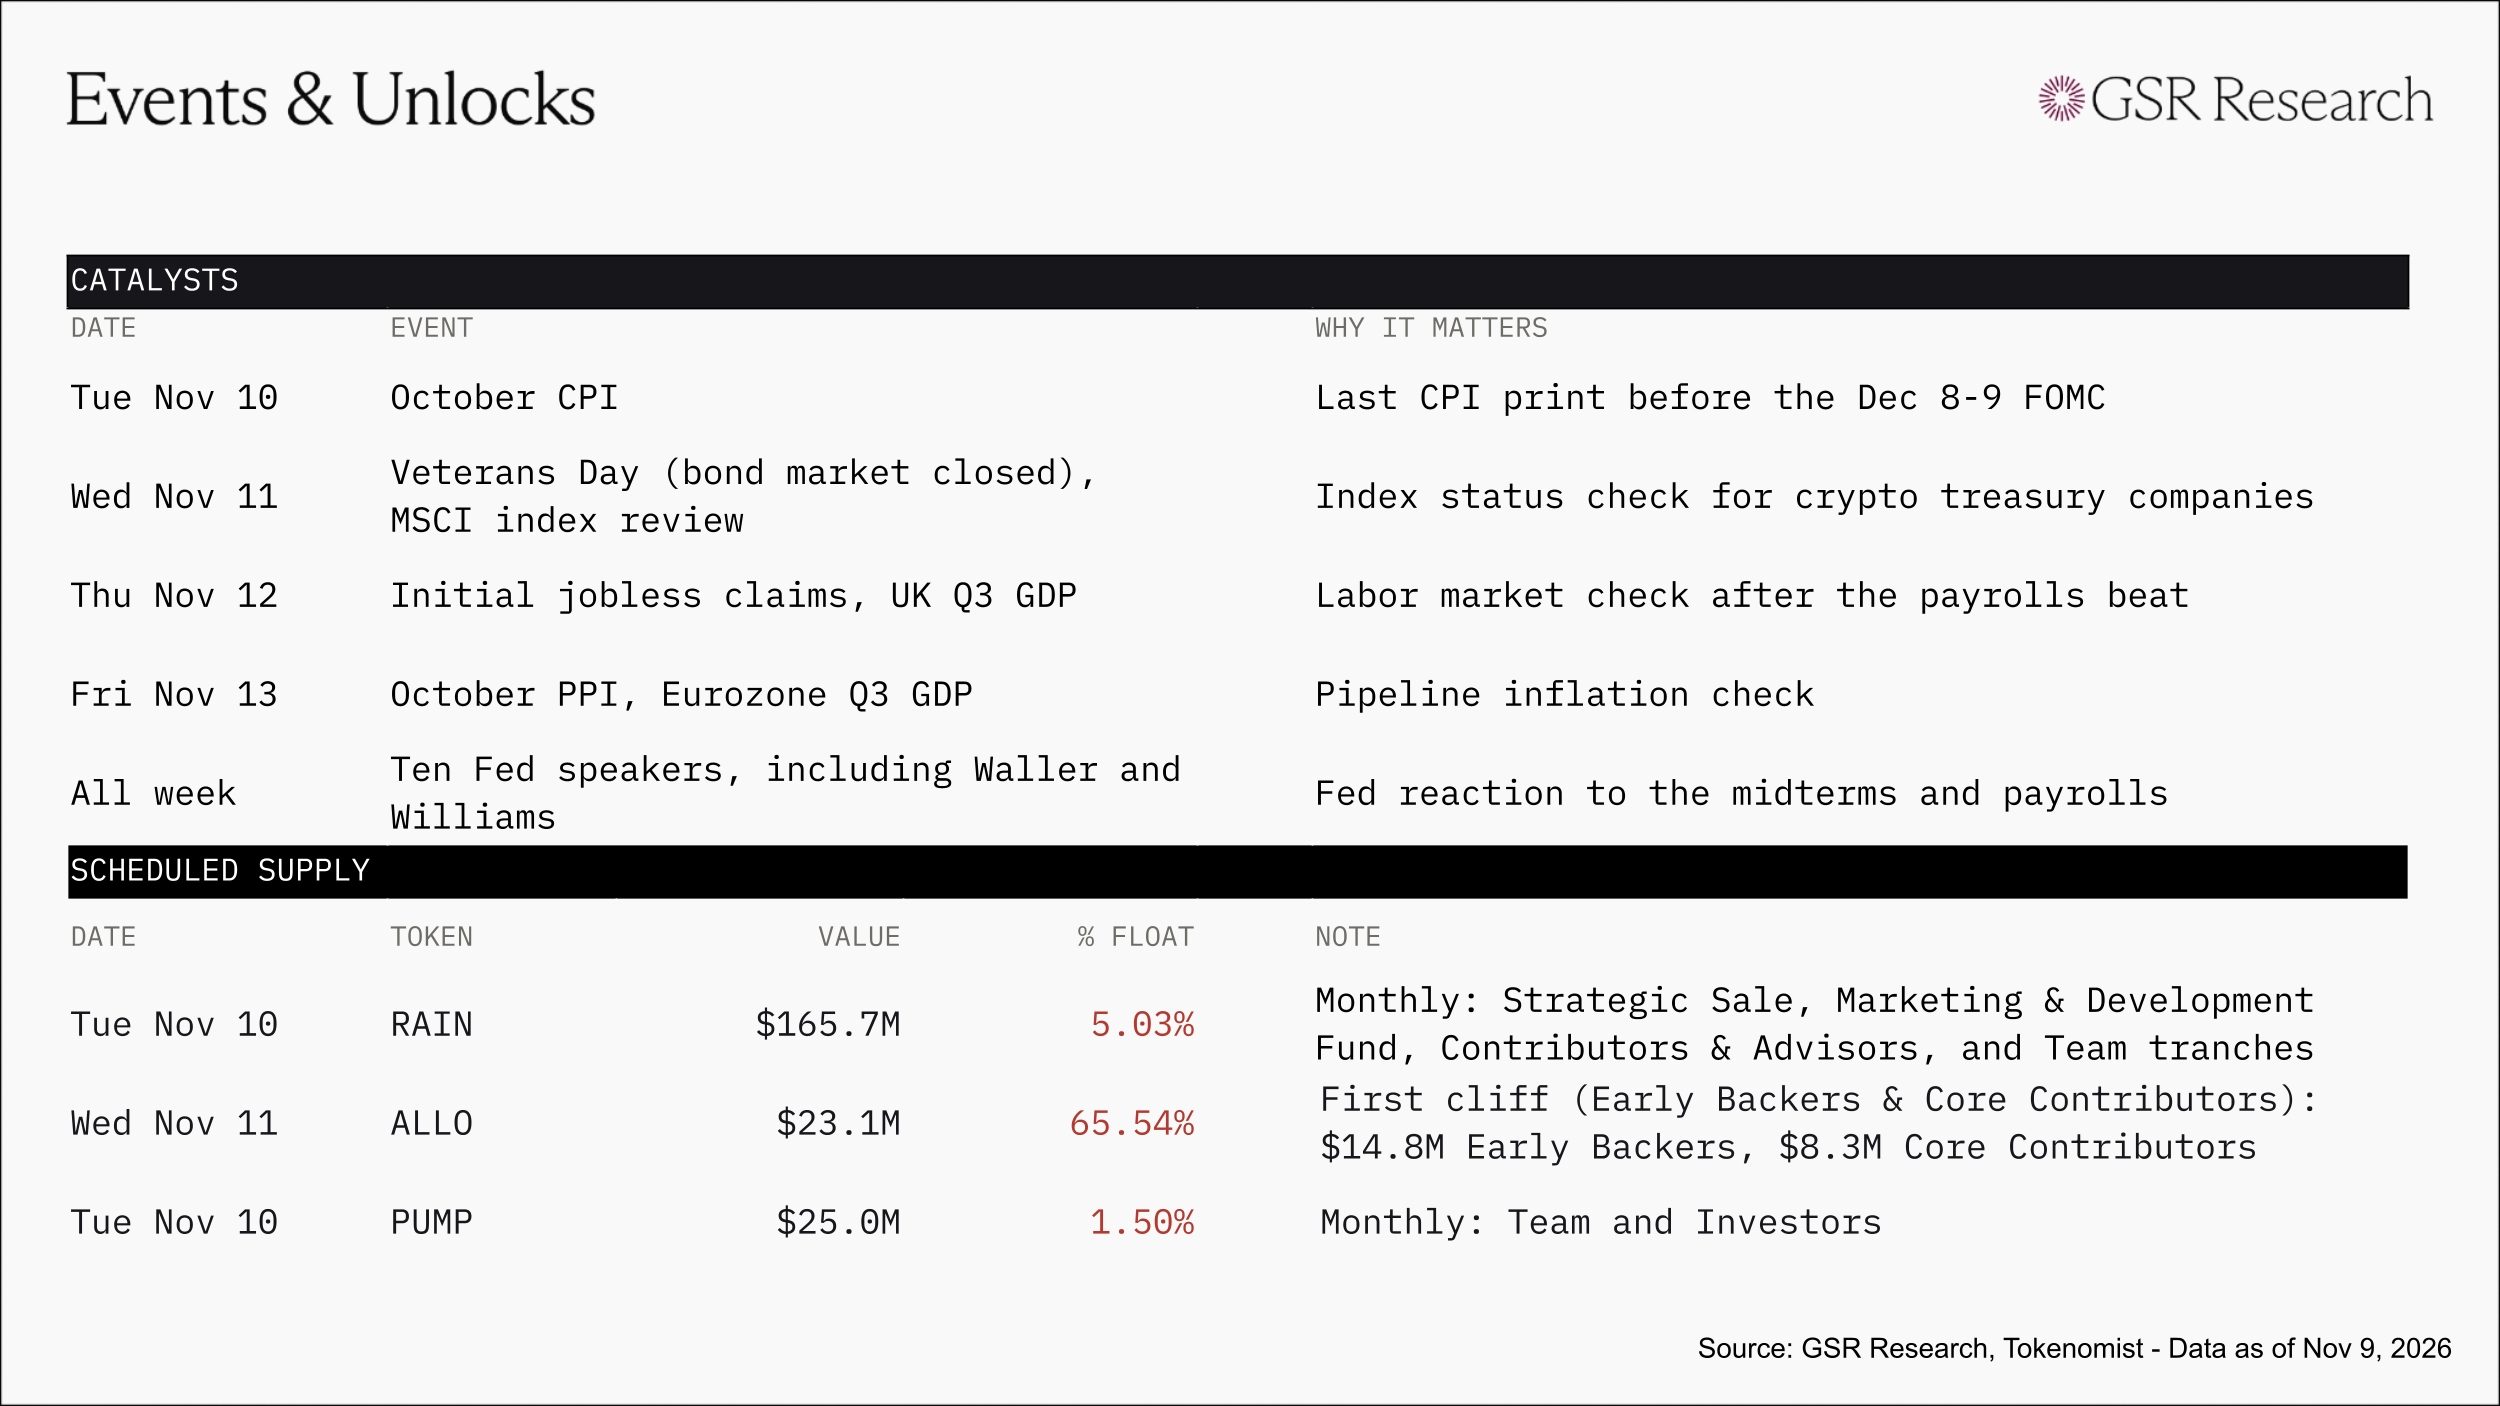
All eyes are on Tuesday's October CPI, Friday's PPI, and ten Fed speakers to provide further reactions since the midterms since the midterms.
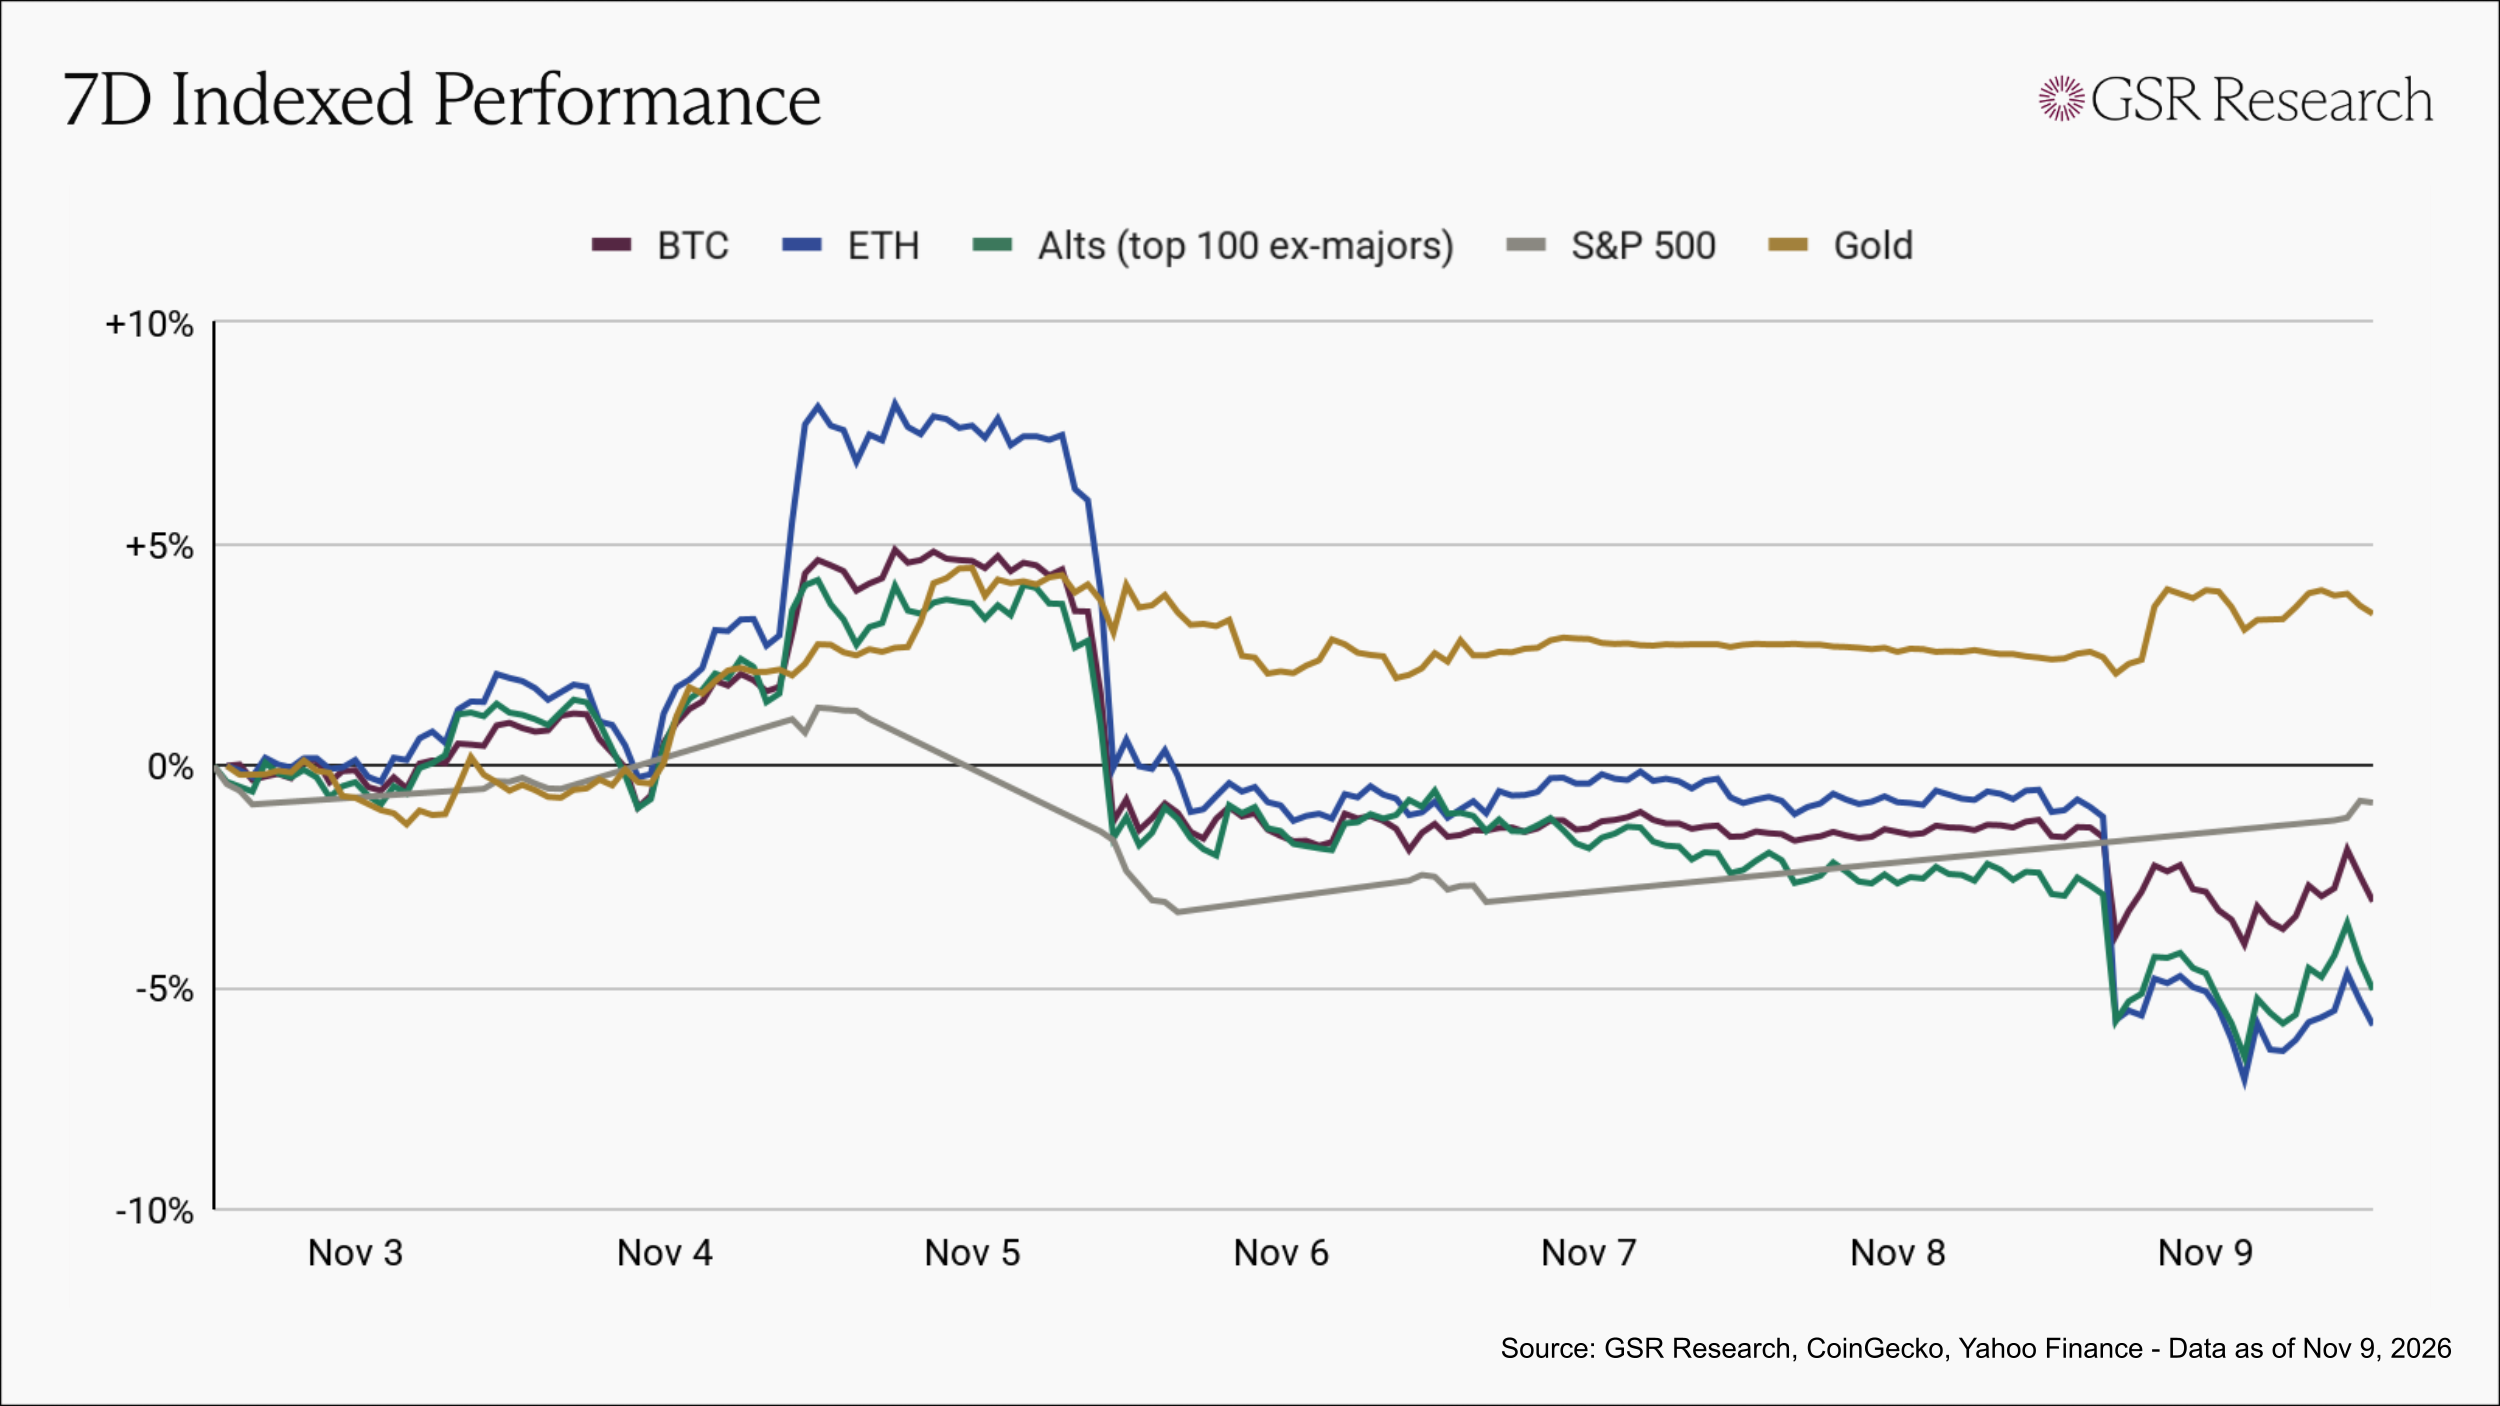
Democrats won control of both the House and the Senate in Tuesday's midterm elections, with BTC trading between roughly $76,500 and $77,800 on Election Day and spot Bitcoin ETFs posted a third straight day of outflows. BTC dipped below $76,000 as results came in overnight before reversing on Wednesday, rising as much as 4.2% to just over $81,000 as U.S. stocks rallied and oil fell on hopes of an end to the Iran war, with roughly $378M of short positions liquidated within an hour. Wednesday was the only session of the week with net inflows into spot Bitcoin ETFs, at $74.6M.
However, sentiment shifted on Thursday, when the Nasdaq Composite fell 5.52% as chipmakers led a selloff driven in part by concerns that the new Democratic majorities could slow AI data center construction, alongside weak forecasts from Qualcomm and Arm. BTC fell from near $80,900 overnight to about $75,600 that afternoon, and ETH fell more than 6%. CME FedWatch odds of a December hike dropped from 83% on Wednesday to 67% as tech stocks sold off, before Friday's October payrolls rose 165,000 against a 65,000 consensus, with August and September revised up a combined 84,000, pushing odds back up to 76.8%. BTC slipped to $74,900 later on Friday, as spot Bitcoin ETFs finished the week with $1.28B of net outflows, including $412M on Friday. The same day, the U.S. Treasury issued a FinCEN order cutting exchange MEXC off from the U.S. financial system. The selling resumed on Sunday evening, when BTC fell from about $75,600 to $73,510 in ten minutes, its lowest level since August, and total crypto liquidations topped $1.15B over 24 hours. BTC finished down ~4% at $75k, ETH ~6% lower, the alt basket down ~5%, gold ~3% higher, and the S&P 0.8% lower.
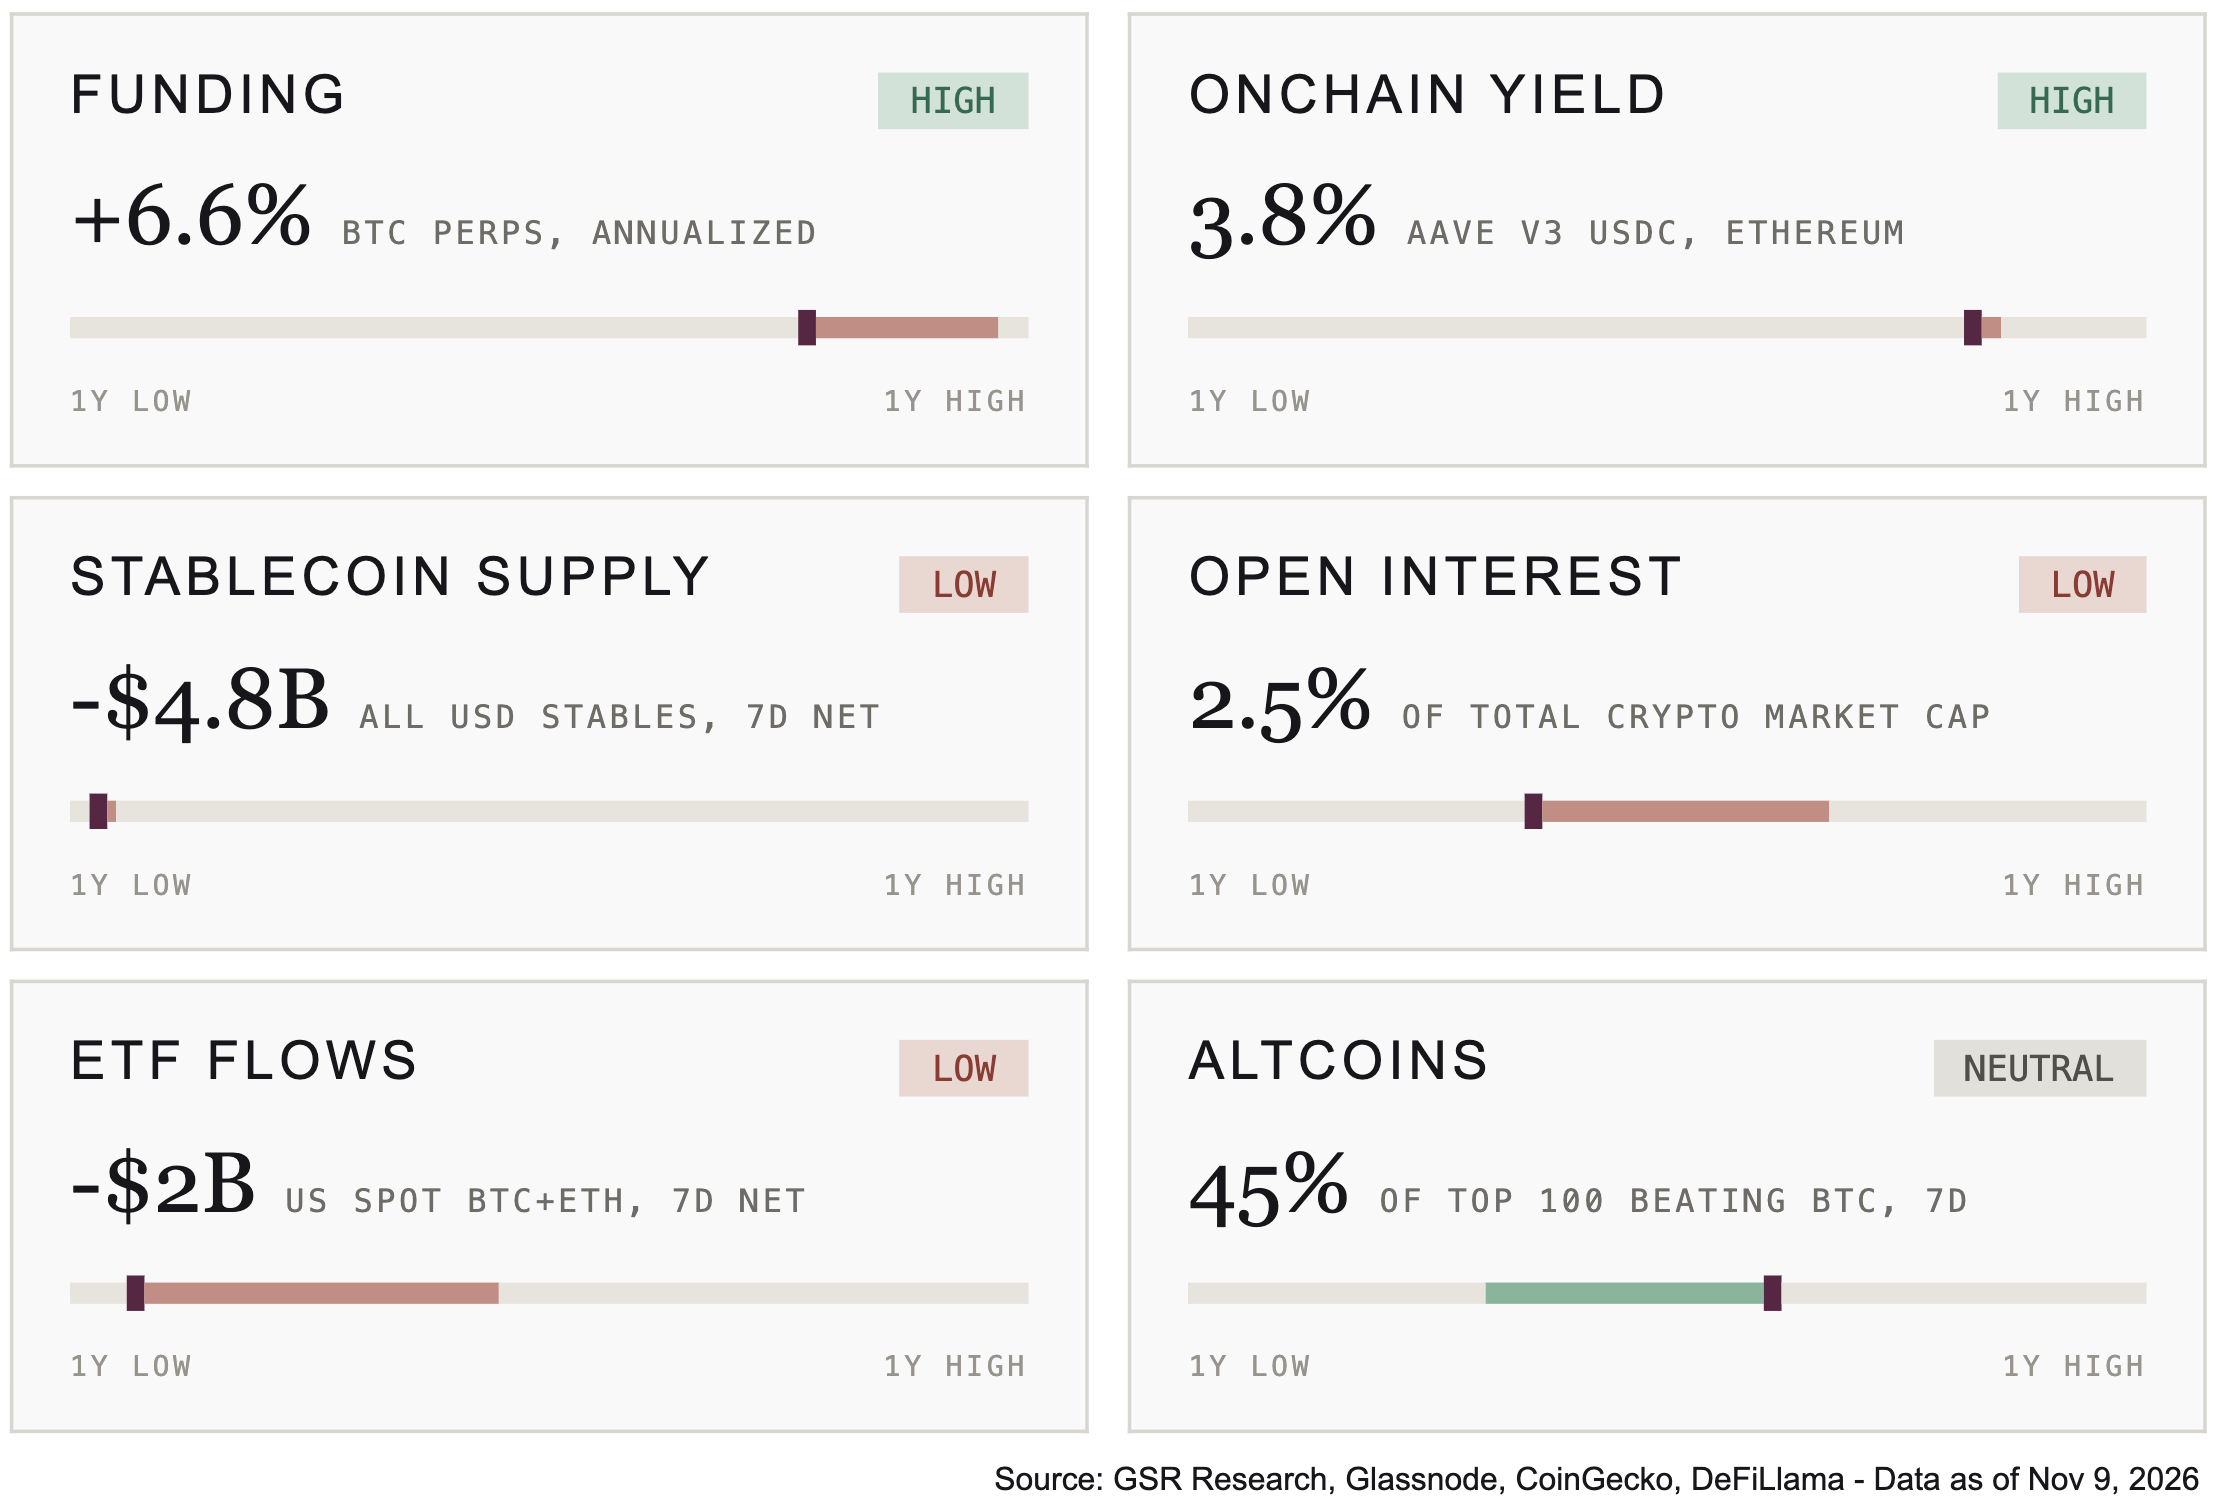
Flow gauges fell further this week while positioning gauges cooled, with altcoin breadth the one exception. Funding eased from +9.4% to +6.6% annualized but held in the high range, while open interest slipped from 2.6% to 2.5% of total market cap, back into the low range. ETF flows fell from -$0.3B to -$2B, near the bottom of their one-year range, and Stablecoin Supply change fell from -$4.6B to -$4.8B, a fifth straight week of net contraction that leaves it near its one-year low. Onchain yield eased from 3.9% to 3.8%. 45 of the top 100 altcoins beat Bitcoin, up from 33 the week prior, moving back into the neutral range.
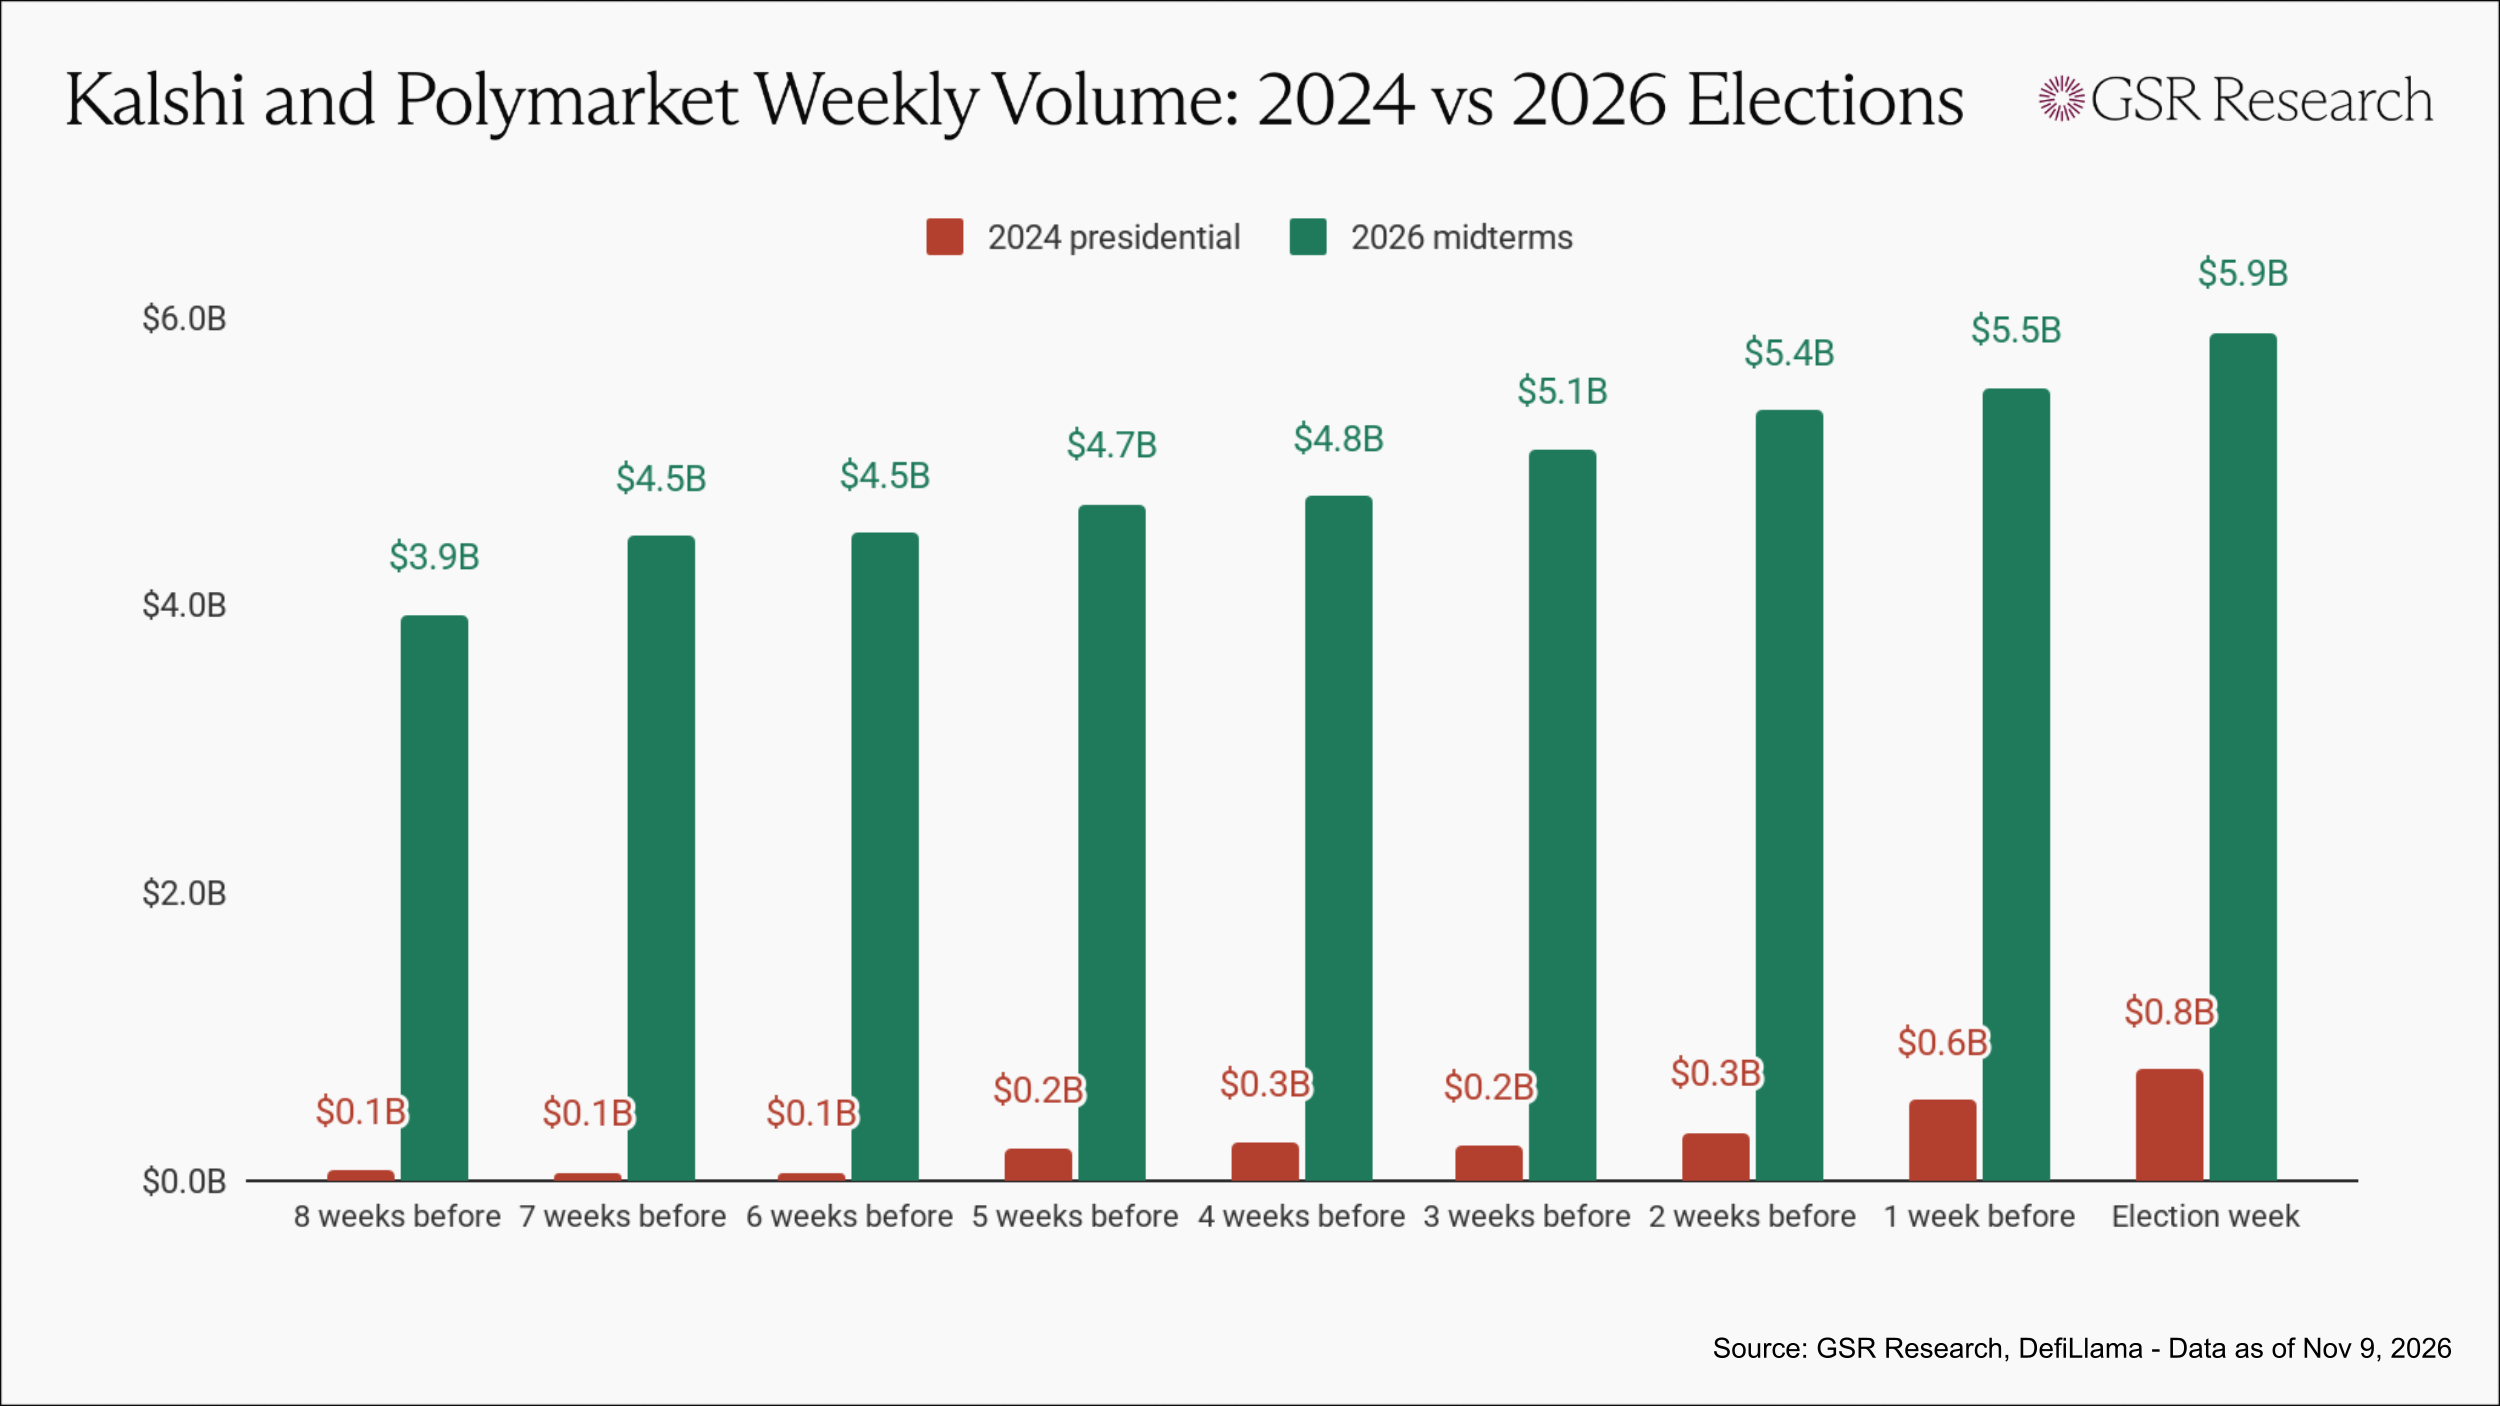
Kalshi and Polymarket traded a combined $5.9B during the week of the 2026 midterms, 7.7x the $0.77B they traded during the week of the 2024 presidential election. Even eight weeks before the midterms, the platforms combined weekly volume was $3.9B, already roughly five times 2024's election week. While volumes have clearly skyrocketed, the more impactful trend is how the election barely impacted the prediction markets’ weekly volumes. Election-week volume ran 14% above the prior four-week average in 2026, versus 121% in 2024.
Both platforms are now less reliant on a single event or trend for high volumes. In October and November 2024, political markets made up 90% of Kalshi's volume and 65% of Polymarket's, and Kalshi had yet to list sports contracts. Sports contracts made up 78% of prediction market trading in October, while political markets made up less than 3% of Kalshi's volume and less than 27% of Polymarket’s volume in every month of 2026.The venue mix has also flipped since 2024. Polymarket accounted for 67% of combined volume in the week of the presidential election, while Kalshi took 77% in the week of the midterms.
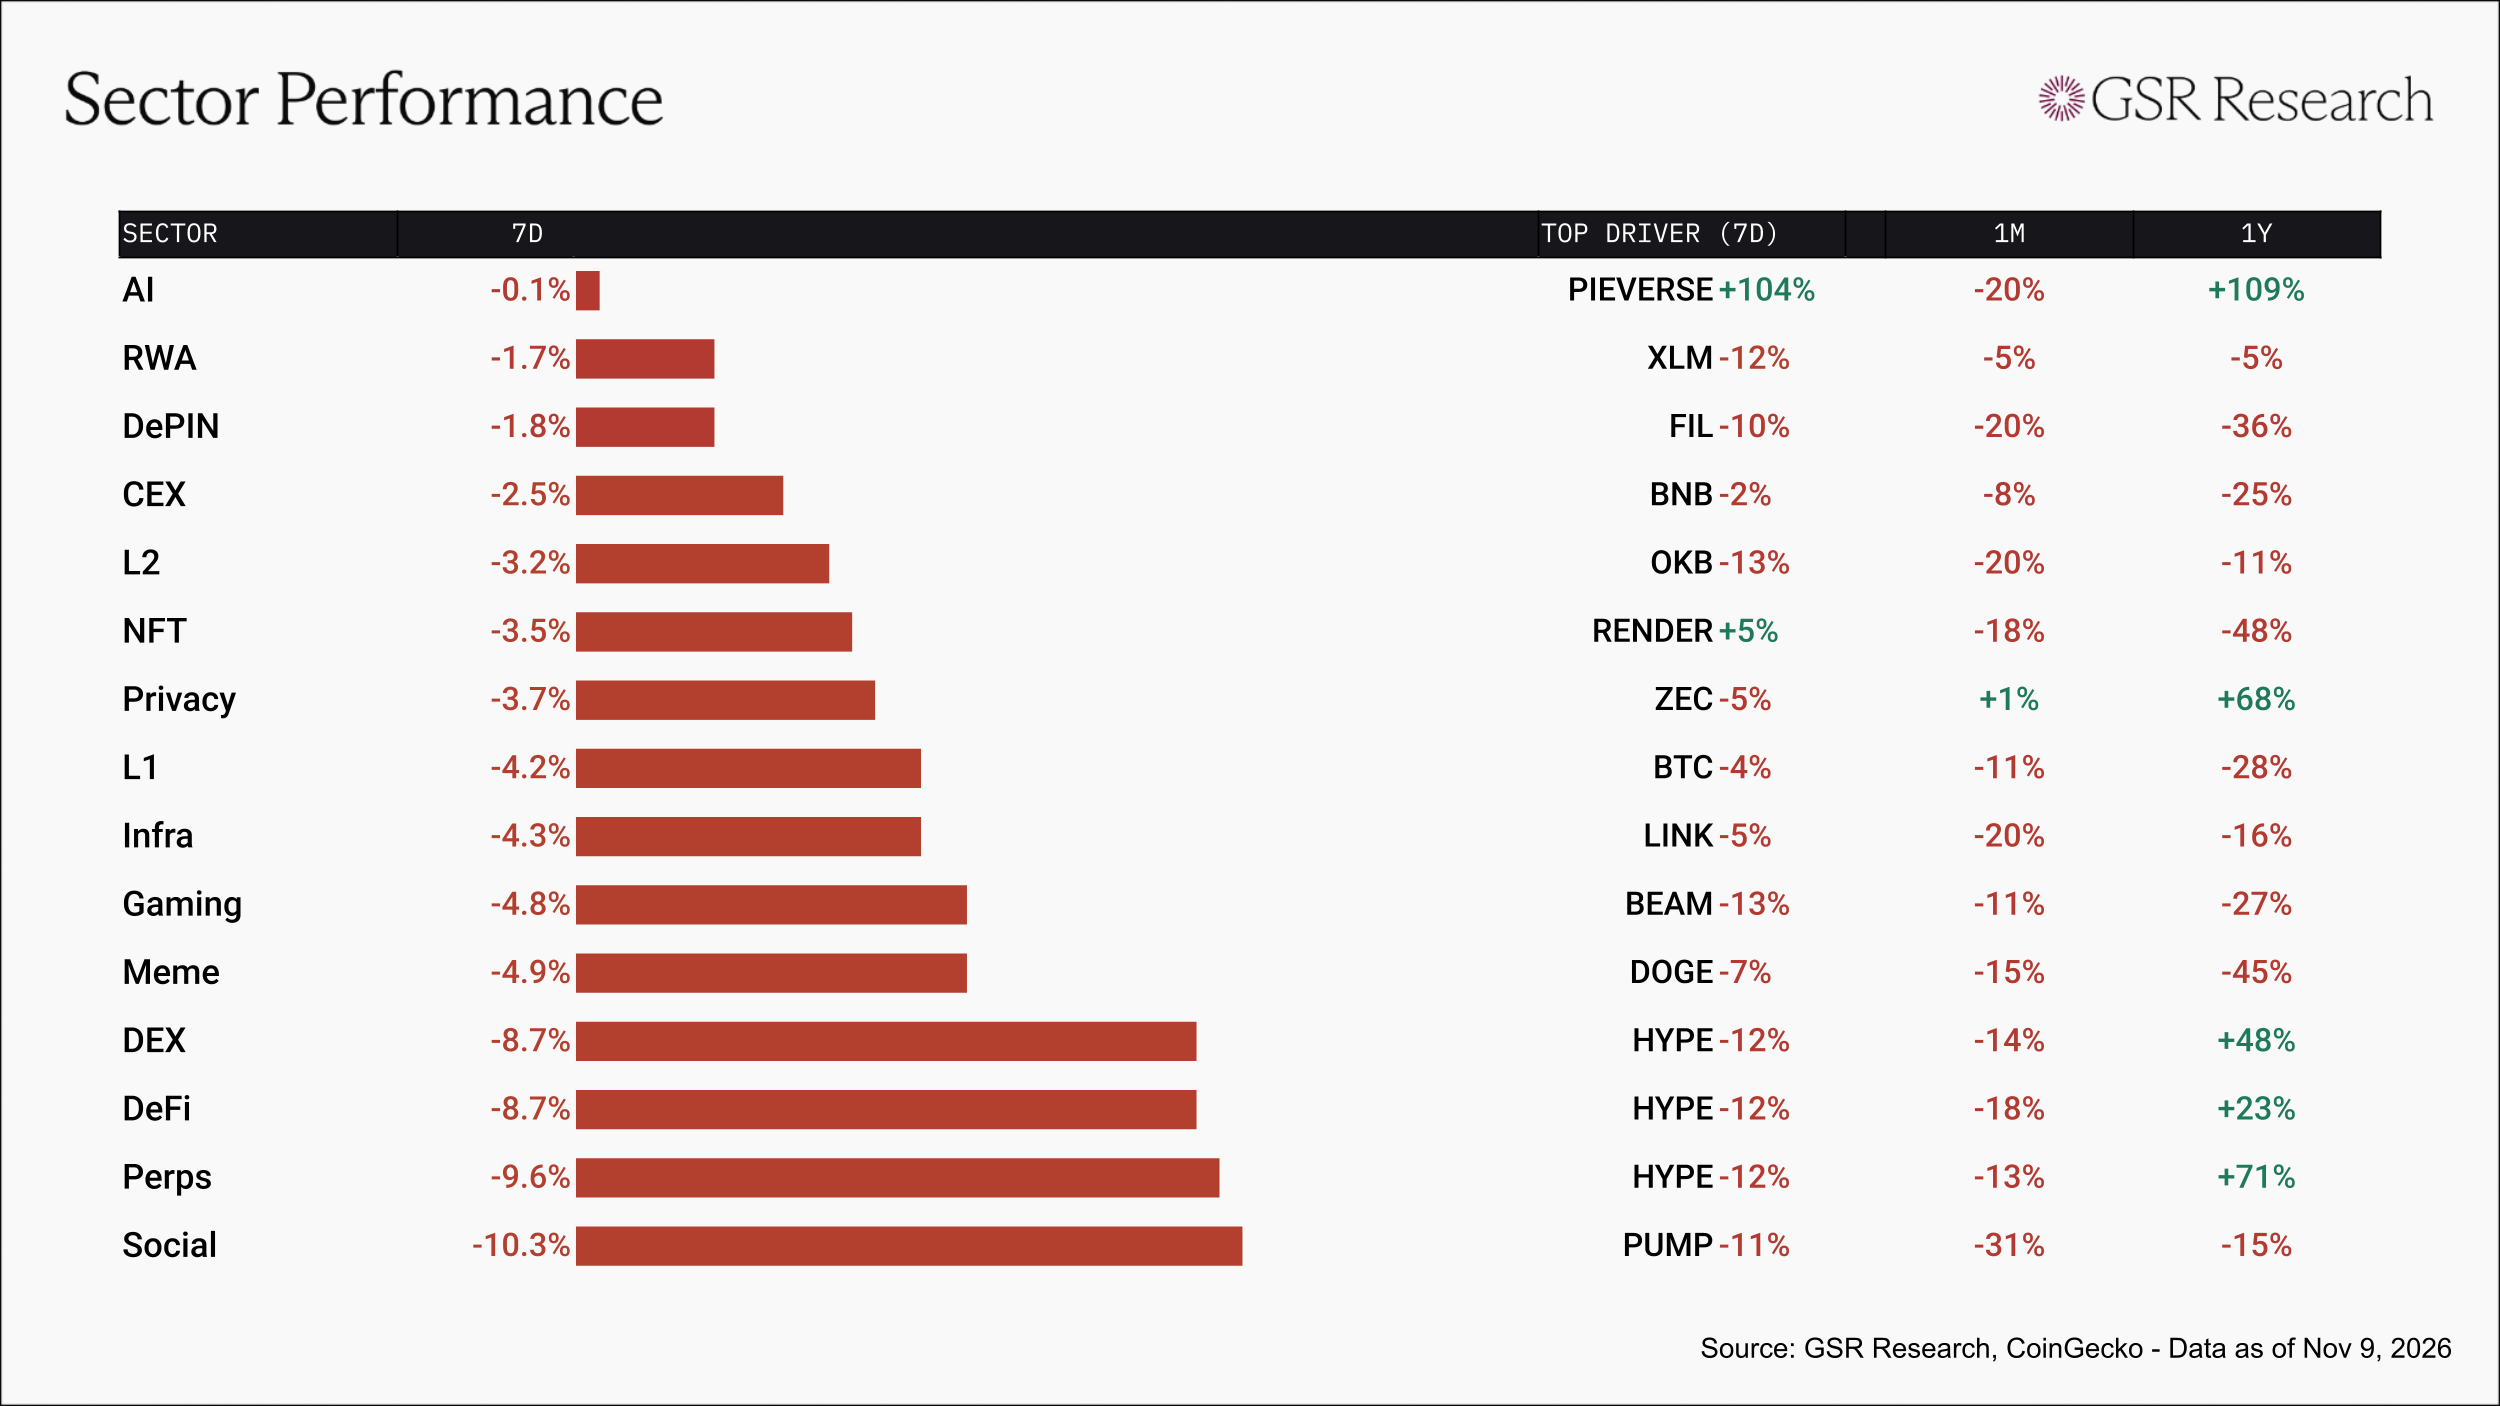
All 15 sectors closed red this week, as AI held near flat at -0.1%. RWA (-1.7%) and DePIN (-1.8%) fell least despite XLM (-12%) and FIL (-10%), CEX (-2.5%) followed BNB (-2%), and L2 (-3.2%) fell less than OKB (-13%). NFT (-3.5%) held up on RENDER (+5%), and Privacy (-3.7%) tracked ZEC (-5%).
Social fell furthest at -10.3% on PUMP (-11%). The Social sector is now down -31% on the month. Perps (-9.6%), DeFi (-8.7%), and DEX (-8.7%) fell with HYPE (-12%), which more than reversed last week's +9% move. Meme (-4.9%) tracked DOGE (-7%), Gaming (-4.8%) fell on BEAM (-13%), which gave back part of last week's +41% rally, and Infra (-4.3%) and L1 (-4.2%) followed LINK (-5%) and BTC (-4%).
Data appendix. Each Market Pulse tile shows where a gauge sits in its own trailing one-year range: the bar runs from the year's low to its high, the dark marker is this week's reading, and the colored span behind it is the week's move, green when the gauge climbed its range and red when it fell. Tags mark position in that range: HIGH above the 65th percentile, LOW below the 35th, NEUTRAL between, with the tag's color carrying the read. Funding is BTC perpetual funding, OI-weighted across major venues and annualized; onchain yield is Aave v3's USDC market on Ethereum; stablecoin flows is the 7-day net change in supply of all USD-pegged stablecoins across all chains per DeFiLlama; open interest sums futures in the twelve largest futures assets (roughly 95% of all crypto futures OI) against total crypto market cap; ETF flows combines US spot Bitcoin and Ethereum funds on a rolling 7 days; and altcoins is the share of the top 100, excluding stablecoins and wrappers, beating BTC over 7 days. Sector returns are cap-weighted CoinGecko categories, top ten constituents each. Sources: GSR Research, Glassnode, Deribit, CoinGecko, DeFiLlama, FRED, Tokenomist.
This material is provided by GSR (the “Firm”) solely for informational purposes. It is not intended to be advice or a recommendation to buy, sell or hold any investment mentioned. Investors should form their own views in relation to any proposed investment.
It is intended only for sophisticated, institutional investors and does not constitute an offer or commitment, a solicitation of an offer or commitment, or any advice or recommendation, to enter into or conclude any transaction (whether on the terms shown or otherwise), or to provide investment services in any state or country where such an offer or solicitation or provision would be illegal. The Firm is not and does not act as an advisor or fiduciary in providing this material.
This material is not an independent research report, and has not been prepared in accordance with any legal requirements by any regulator (including the FCA, FINRA or CFTC) designed to promote the independence of investment research.
This material is not independent of the Firm’s proprietary interests, which may conflict with the interests of any counterparty of the Firm. The Firm may trade investments discussed in this material for its own account, may trade contrary to the views expressed in this material, and may have positions in other related instruments. The Firm is not subject to any prohibition on dealing ahead of the dissemination of this material.
Information contained herein is based on sources considered to be reliable, but is not guaranteed to be accurate or complete. Any opinions or estimates expressed herein reflect a judgment made by the author(s) as of the date of publication, and are subject to change without notice. The Firm does not plan to update this information.
Trading and investing in digital assets involves significant risks including price volatility and illiquidity and may not be suitable for all investors. The Firm is not liable whatsoever for any direct or consequential loss arising from the use of this material. Copyright of this material belongs to GSR. Neither this material nor any copy thereof may be taken, reproduced or redistributed, directly or indirectly, without prior written permission of GSR.
Please see here for additional Regulatory Legal Notices relevant to US, UK and Singapore.