
OTC Trading Commentary - Sept 13th
MACRO + CRYPTO SUMMARY
Post Jackson Hole, higher US rates and a strong dollar have caused risk assets (including digital ones) to be sold and to flounder at various support levels. As yields topped out, the ECB hiked, and Japan jawboned to stem currency weakness, the DXY suddenly felt a bit stretched and since mid last week it started trading heavily, boosting the price action in stocks and crypto alike. Bitcoin rallied over 8% on Friday and the bullish price action across the crypto complex has continued until now. The upcoming ETH merge will be closely watched before attention is turned back to Fed, with cynics among us gauging their resolve into midterms. The interest rate outlook is going to remain the main driver into year-end.
RATES, FUNDING & BASIS
Institutional bilateral lending markets in crypto went into a state of standstill back in June as lenders waited for any contagion effects to play out, and for visibility on Q2 financials to gauge the impact of the market on any of their borrowers. However, this market has continued to recover, and we see increasing appetite for both credit and duration risk among lenders. Rates are now relatively higher compared to where they were earlier this year, reflecting a lower supply of capital in general, but also to an extent higher risk-free fiat rates driven by Fed hikes.
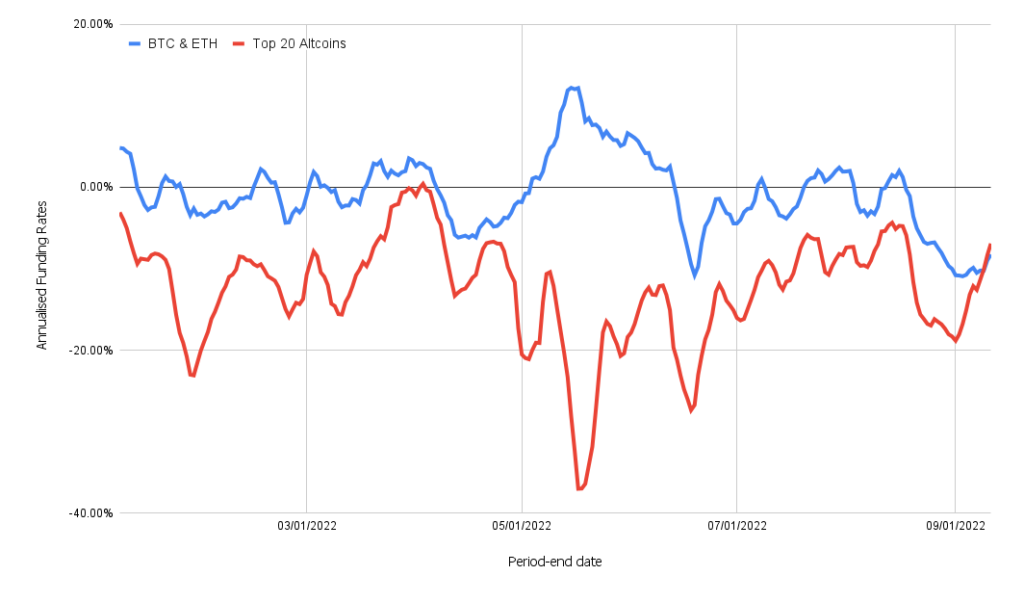
In the perps market, we monitor funding rates across two indices to capture broad market themes. The first index is the average FTX funding rate of BTC & ETH, while the second is the average FTX funding rate of the top 20 altcoins. Over the last two weeks, both these indices have diverged significantly. The bullish sentiment in general has led to altcoin funding rates higher by close to 10%. On the other hand, ETH funding rates have collapsed significantly ahead of The Merge, as a discount for the ETH POW token gets priced in. Given the staking yield in the ETH proof-of-stake (PoS) token after the merge goes through, we expect funding rates to continue to be negative in ETH post the merge, as arbitrageurs buy cash ETH, stake it, and sell perps to generate a USD return.
7-Day Rolling Average on Perp Funding Rates
Source: GSR, FTX
In the futures space, the ETH curve continues to be discontinuous ahead of the merge. ETH 23Sep22 futures (which expire after the expected merge around the 15th of September), trade at a ~$14 discount to ETH/USD spot. The easiest way to explain this discrepancy is that ETH 23Sep22 futures reference the ETH PoS token specifically, while ETH spot is expected to essentially decompose into an ETH PoS token as well as an ETH proof-of-work token. The market therefore implies an expected value of $14 for the ETH PoW token by this measure.
DERIVATIVES
BTC Derivatives
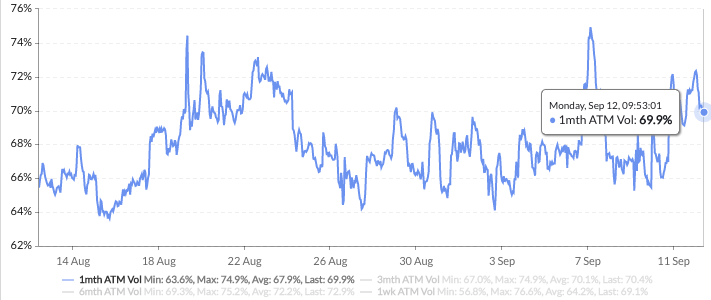
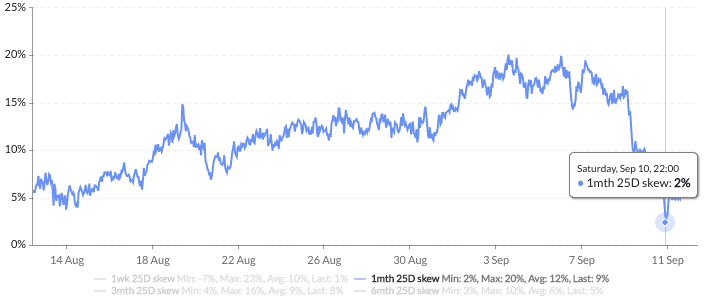
When BTC finally broke $19,500 after 10 days of support, 1 month implied volatility popped from 68% to 75%, a level not seen since June this year (justifying the steep Put Skew). However, with no follow-through below $18,700, vol quickly normalized.
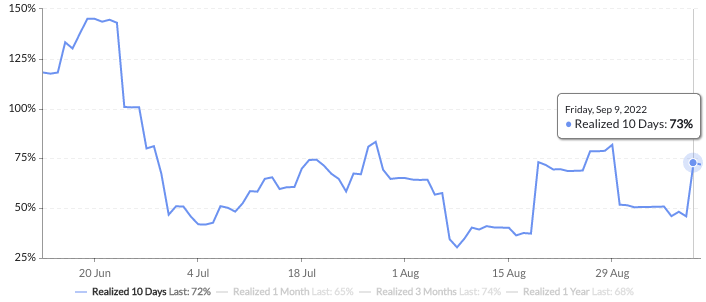
The subsequent $4,000 rally has seen a small pick up in vol to 70%, but a very significant softening in put skew from 16% to 2% over the weekend. Post-summer, 10day realized vol has picked up to 73%, from 49% at the end of August.
BTC 1 Month ATM Vol
Source: Skew, GSR.
BTC 1 Month 25delta Put Skew
Source: Skew, GSR.
BTC 10 Day Realized Vol
Source: Skew, GSR.
ETH Derivatives
The 16Sep (ETH Merge) vol is now 120%, pricing >6% or $110 of movement/day – time will soon tell if this is expensive or not (average vol is ~90%). 1 month vol remains above 100%, something we wouldn’t expect to sustain after this week is over.
Call skew has risen along with the underlying, and 1 month put skew is currently priced at a median 8%. 10 day realized has not witnessed the same post-summer pick-up as BTC, and is currently very low at 56%.
ETH 1 Month ATM Vol
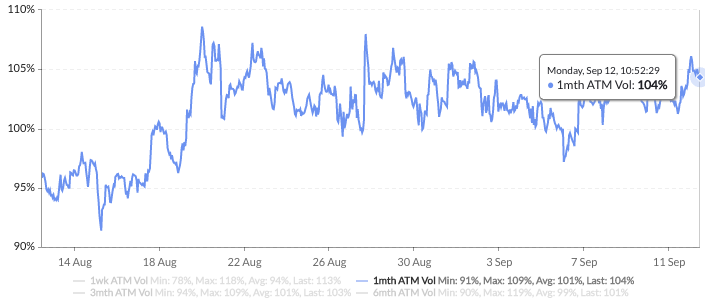
Source: Skew, GSR.
ETH 1 Month 25delta Put Skew
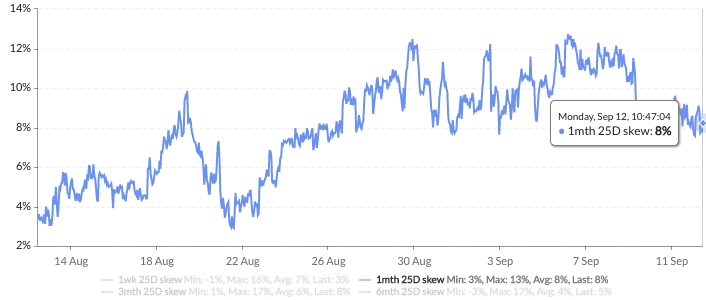
Source: Skew, GSR.
ETH 1 Month 25delta Put Skew

Source: Skew, GSR.
ETH 10 Day Realized Volatility
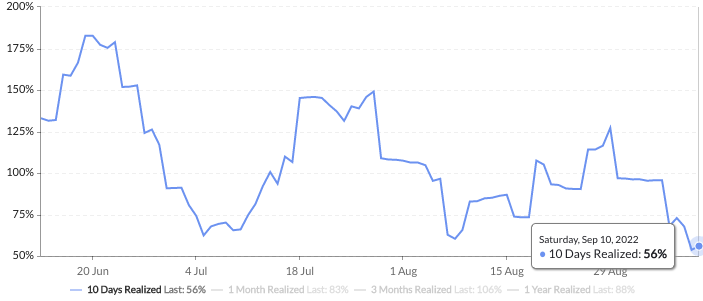
Source: Skew, GSR.
Flows and Liquidations
The most recent price action in both BTC and ETH has been exciting, with the largest amount of short liquidations since late July occurring on September 8th ($305.9m), with a majority of long liquidations happening on September 5th ($249m). The amount of liquidations on both ends pales in comparison to the $562m long liquidations on August 18th, and $421m short liquidations from July 17th.
The put/call ratio by volume when compared in conjunction with put call ratios by open interest for both BTC and ETH help visualize the short-term and long-term sentiment of the options market participants. In BTC, the P/C ratio by volume shows relatively bearish sentiment with the ratio above 1.0 leading up to the September 8th liquidations.
BTC Put/Call Ratios
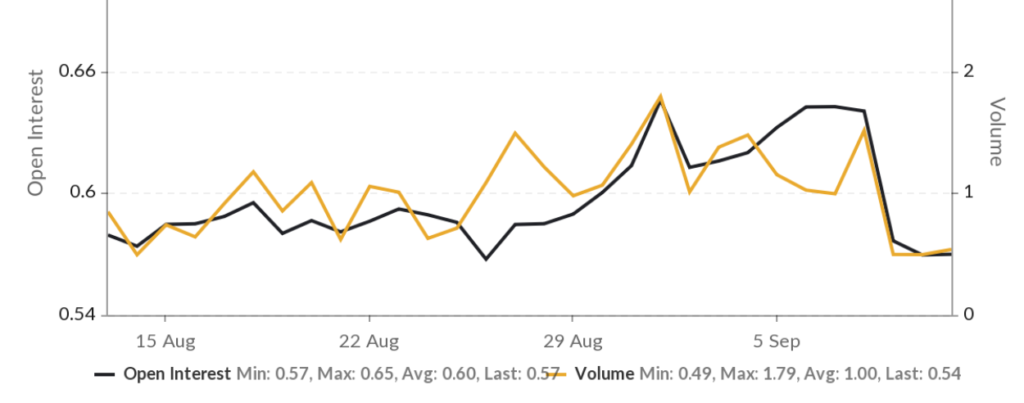
Source: Skew, GSR.
In ETH, the P/C ratio by volume suggests a more bullish sentiment, with only two days (Aug 30th, and September 4th) showing a ratio greater than 1. In terms of longer viewpoints on BTC and ETH, the P/C ratio by open interest indicates that for every open put there are 4 open calls, while for BTC for every open put there are 2 open calls.
ETH Put/Call Ratios
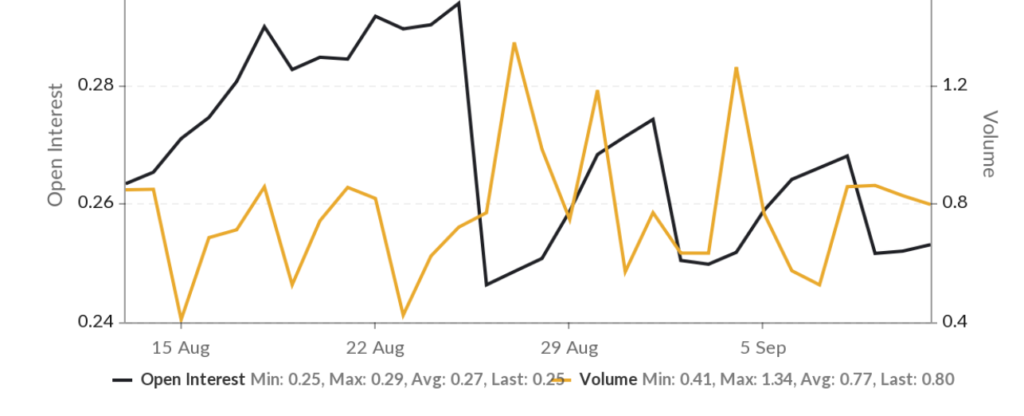
Source: Skew, GSR.
Historical flows over the past two weeks show most premiums for BTC flowing in on Friday with a similar peak in ETH. BTC flows have been relatively muted compared to ETH in terms of the premium spent/collected, as investors position themselves for The Merge. There has also been a large demand for the 2K ETH calls across all expiries, as well as for a variety of further OTM strikes ranging from 3K to 15K. In BTC, the largest change in OI has been seen in the 24K strike calls and 16K strike puts, with a few wingier OTM strikes opening as well in the 36-50K region.
BTC Options Volumes
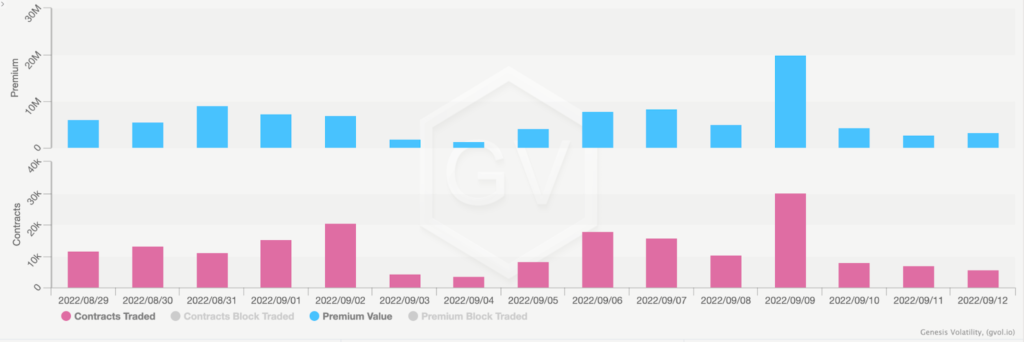
Source: Genesis volatility, GSR.
ETH Options Volume
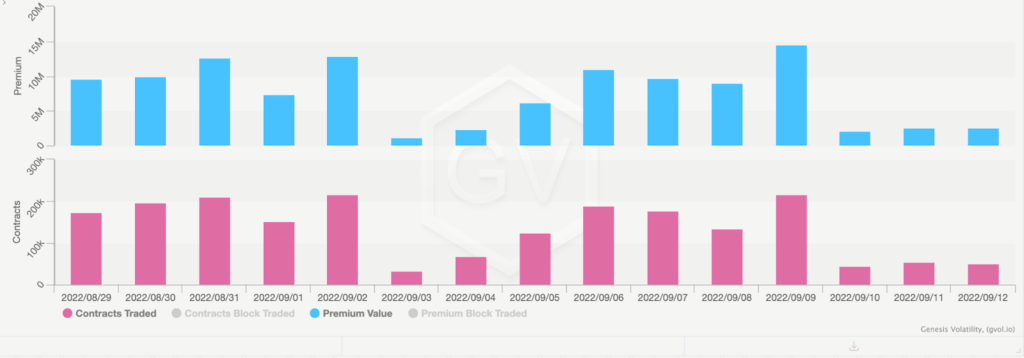
Source: Genesis volatility, GSR.
Historical BTC OI Change
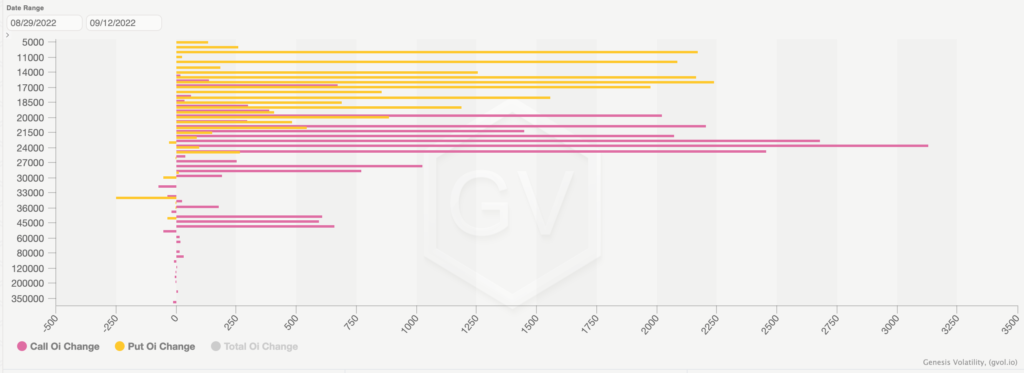
Source: Genesis volatility, GSR.
Historical ETH OI Change
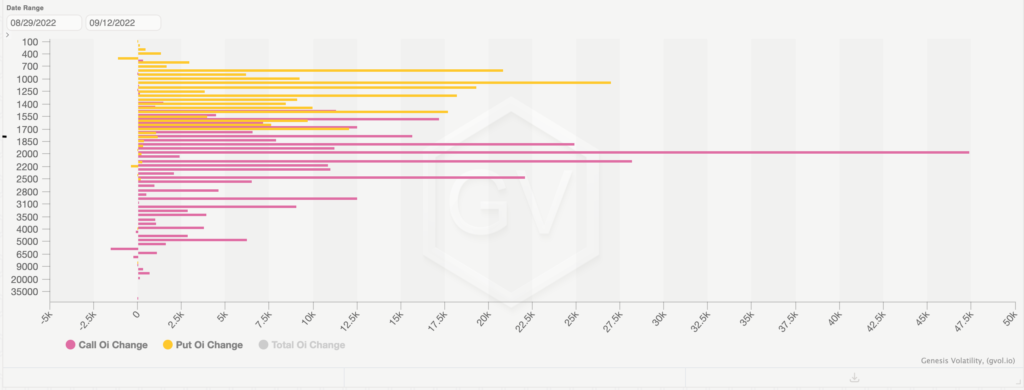
Source: Genesis volatility, GSR.
Altcoin vol
Altcoin vols have declined slightly, this time inline with the decline seen in ETH vol. The Merge has dominated the short-term volatility environment in crypto currently. Given the merge and CPI this week, as well as the correlation between altcoin and ETH volatility, this week may see an increase in volatility for alts and ETH across the board.
DeFi
As an overall update regarding news in the DeFi markets, we’ve seen GMX continue to see strong usage numbers, with volumes increasing and catching up to the leading perp DEX, dYdX. Recently, there has also been a large number of GMX forks appearing as well. Maker protocol revenue has fallen significantly with net liquidation income going to zero, while the overall net protocol income has also fallen negative for the first time. On-chain borrow-lending platforms have seen yields rise (which should continue to do so) as investors borrow ETH into The Merge for a potential ETH proof-of-work fork. Frax has officially launched FraxLending, CRV github has been updated to include a contract for a future CRV stablecoin, and Yearn Finance has deployed veYFI.
WHAT WE’RE WATCHING
We’re keeping an eye on ETH 1 month vol, as historical data points to vol levels of 100% being richer than usual. Ahead of the merge, we’ve also taken note that the largest derivative exchanges imply an ETH PoW fork with a value of $14. Futures on ETH PoW on smaller exchanges are implying almost double that.
Authors:
Mike Pozarzycki – Macro & Crypto Summary
Ruchir Gupta – Rates, Funding and Basis
John Cole – Derivatives
Christopher Newhouse – Flows and Liquidations
Mitch Galer – Altcoin Vol
Calvin Weixuan Goh – DeFi
Disclaimers: “This material is a product of the GSR Sales and Trading Department. It is not a product of a Research Department, not a research report, and not subject to all of the independence and disclosure standards applicable to research reports prepared pursuant to FINRA or CFTC research rules. This material is not independent of the Firm’s proprietary interests, which may conflict with your interests. The Firm trades instruments discussed in this material for its own account. The author may have consulted with the Firm’s traders and other personnel, who may have already traded based on the views expressed in this material, may trade contrary to the views expressed in this material, and may have positions in other instruments discussed herein. This material is intended only for institutional investors. Solely for purposes of the CFTC’s rules and to the extent this material discusses derivatives, this material is a solicitation for entering into a derivatives transaction and should not be considered to be a derivatives research report. This material is provided solely for informational purposes, is intended for your use only and does not constitute an offer or commitment, a solicitation of an offer or comment (except as noted for CFTC purposes), or any advice or recommendation, to enter into or conclude any transaction (whether on the indicative terms shown or otherwise), or to provide investment services in any state or country where such an offer or solicitation or provision would be illegal. Information is based on sources considered to be reliable, but not guaranteed to be accurate or complete. Any opinions or estimates expressed herein reflect a judgment made as of the date of publication, and are subject to change without notice. Trading and investing in digital assets involves significant risks including price volatility and illiquidity and may not be suitable for all investors. GSR will not be liable whatsoever for any direct or consequential loss arising from the use of this Information. Copyright of this Information belongs to GSR. Neither this Information nor any copy thereof may be taken or rented or redistributed, directly or indirectly, without prior written permission of GSR. Not a solicitation to U.S. Entities or individuals for securities in any form. If you are such an entity, you must close this page.”
