MACRO + CRYPTO SUMMARY
The macro picture of the last two weeks is that of abating US inflation (UK and EU inflation is still hot) where headline inflation in April rose 4.9%, down from +5.0% the month prior. Despite tightening credit conditions for households and businesses, the jobs market is robust, consumer spending is strong, and other macro indicators like industrial production and manufacturing indices are solid. At the same time, however, the yield curve suggests an imminent recession.
The broader macro markets have been interesting to watch, with overall yields higher after the most recent FOMC meeting, stocks roughly unchanged, gold down slightly, and the US dollar back up from its recent leg lower. Though higher than two weeks ago, the VIX is still hovering at levels that are not historically high.
In the near term, the largest unknown variable is the US debt ceiling, which provides some headline roulette if one believes the process is genuine and that a last-minute deal is not a given. The cynical among us, which includes the author, take it for a political Kabuki and don’t give it much heed, at least with regard to its potential to spur volatility.
DERIVATIVES
Implied volatility levels remain relatively muted across the majors, with price action range bound. BTC’s rolling 30-day and 90-day ATM vol is pricing around 46% and 47%, respectively, representing the 8th and 2nd percentiles over the past year and showcasing a relatively flat vol term structure (there is only a 3 vol contango between the 1-month and 6-month parts of the curve).
BTC ATM Implied Volatility (30 and 90-Day)
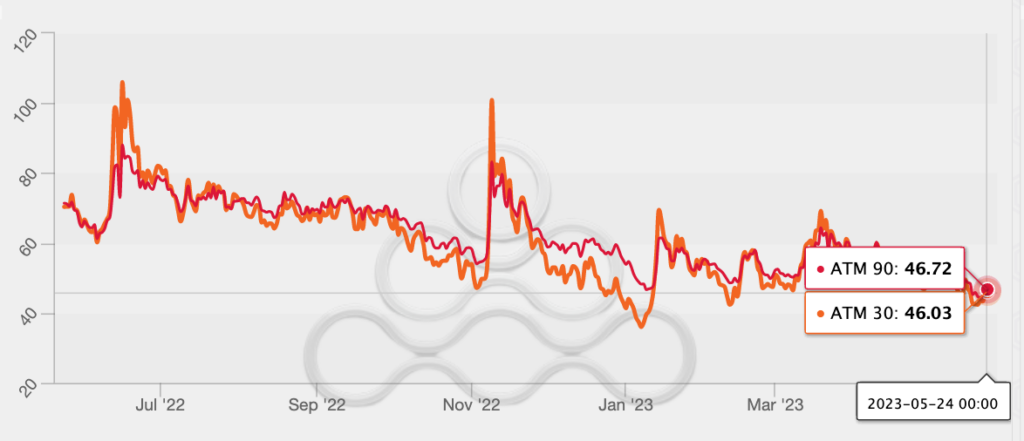
Source: Amberdate, GSR
BTC 30-day 25 delta risk reversals have reverted to the range we’ve observed since the end of 1Q23, pricing calls nearly 2 vols under puts (equating to the 63rd percentile over a one-year lookback).
BTC 30-day 25 Delta Skew (C-P)
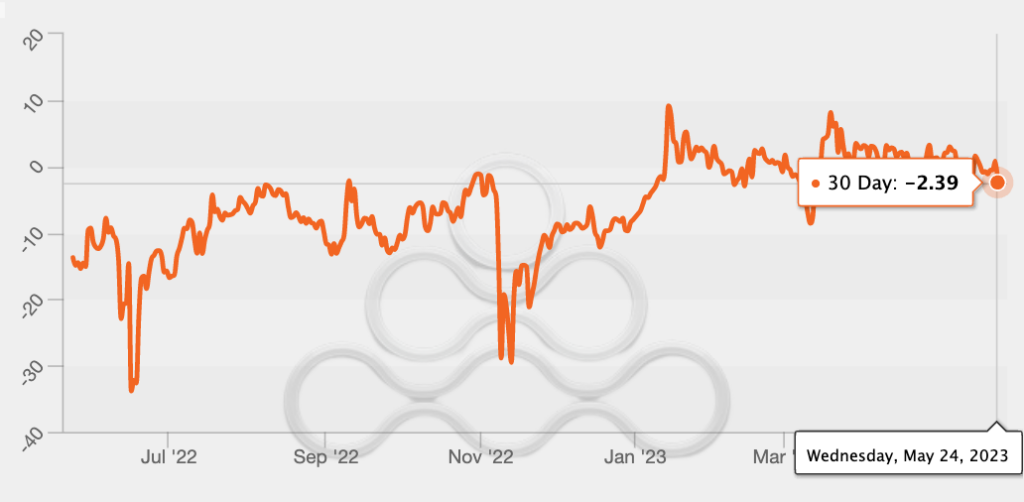
Source: Amberdata, GSR
ETH implied vol levels are pricing on par with BTC, with ETH 30-day and 90-day levels hovering around 44% and 46% (near the 1st percentile over the past year).
ETH ATM Implied Volatility (30 and 90-Day)
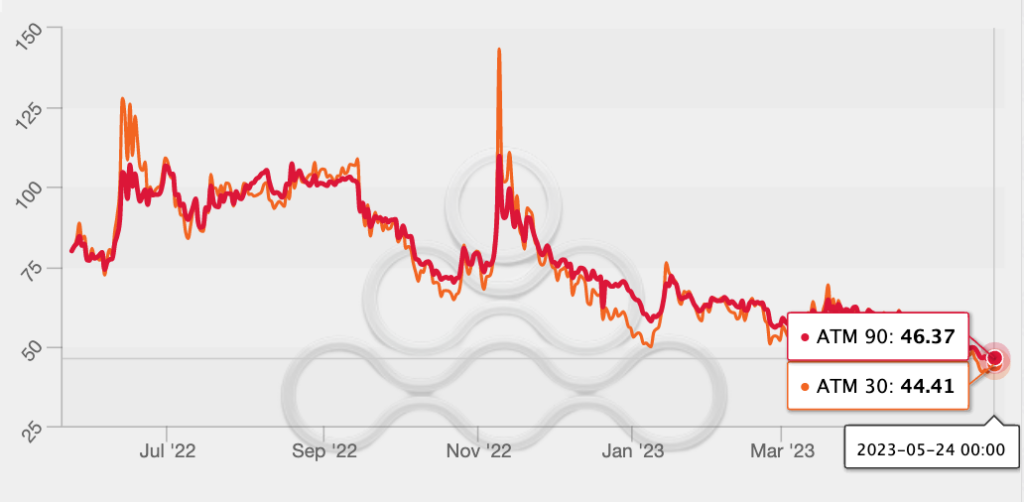
Sources: Amberdata, GSR
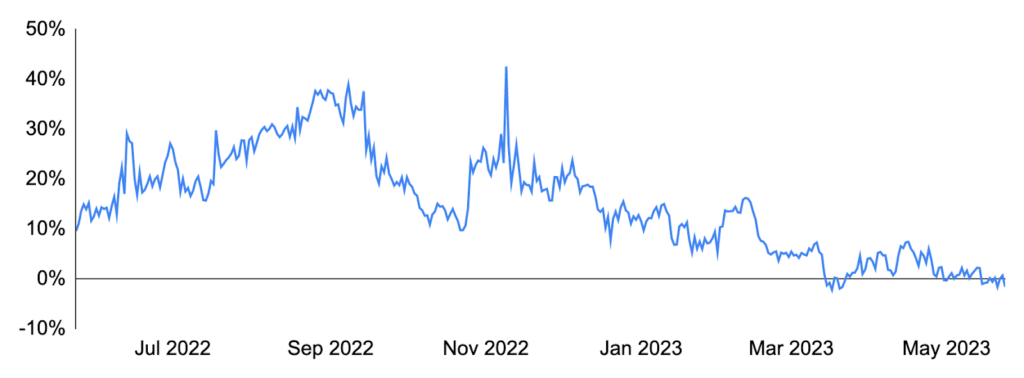
With call premiums having retraced, ETH 30-day 25 delta risk reversals are pricing call skew nearly 5 vols under puts (60th percentile over a year).
ETH 30-day 25 Delta Skew (C-P)
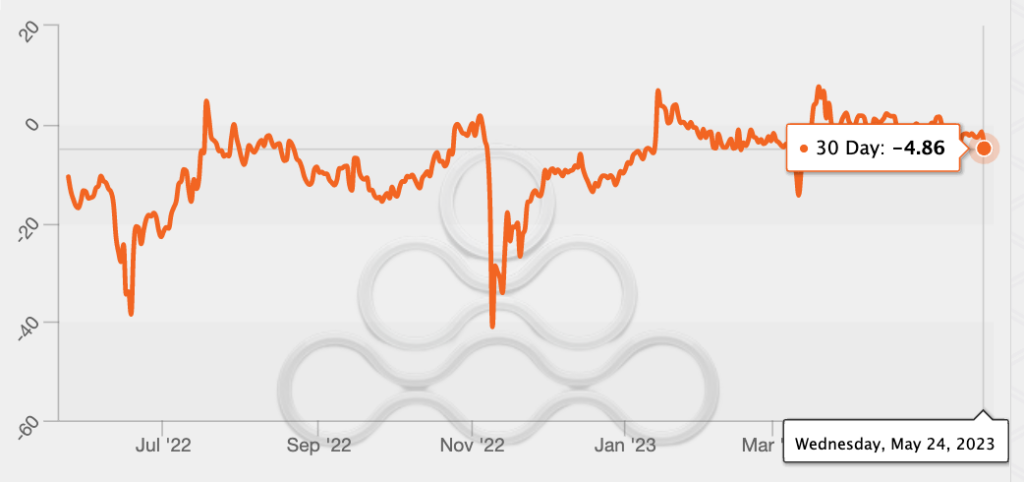
Sources: Amberdata, GSR
Moreover, the vol spread between ETH and BTC remains compressed, with ETH 30-day ATM implied vols pricing nearly 2 vols below BTC (1st percentile over the past year). One of the largest contributing factors to depressed levels of ETH implied vol has been the sizable calendar rolls that went through the market, with 63k of the Jun23/Sep23 2200 calendar rolls trading (selling ~150k+ vega), further flattening the vol term structure.
30-Day ATM ETH vs BTC Implied Vol Spread
Sources: Amberdata, GSR
30-Day ETH and BTC Realized Volatility
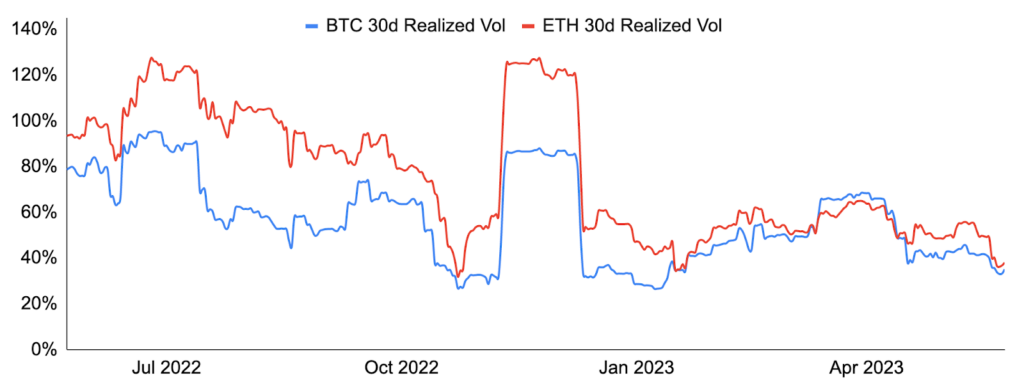
Sources: CoinGecko, GSR
FLOWS AND LIQUIDATIONS
Overall flows and liquidations have been quiet with realized volatility at the lows. It goes hand in hand with the current narrative of low liquidity with large institutional players pulling liquidity in the current regulatory environment. As a result, we have seen overall exchange, trading, and general flow volumes decrease.
Cryptocurrency Monthly Exchange Volume
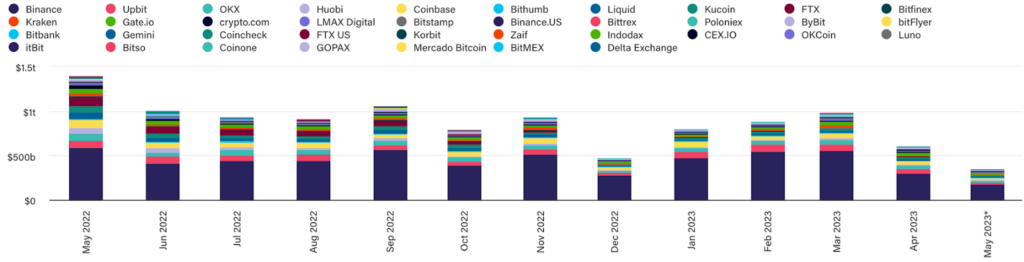
Sources: The Block, GSR. Note: May 2023 volume is through May 24
Altcoins
We’ve seen a number of interesting occurrences recently in the altcoin space, including:
- The market has seen notable interest in different convexity plays for Litecoin ($LTC) in the form of outright calls, call spreads, and straddles over the past week. With the next Litecoin halving two months out (and the block reward falling to 6.25 LTC), 30-day realized vol continues to remain range bound between 50-60%.
- Although most of the well-established altcoins continue to perform in line with the majors when it comes to realized volatility, there are a few notable exceptions including LooksRare ($LOOKS), where the rolling 30-day has spiked to ~130%.
- Synthetix ($SNX) has seen an uptick over the past two weeks, rallying 11%, partly driven by Kain Warwick’s proposal to potentially split and buy back tokens (and subsequently burn them) as a means of motivating broader participation in the network.
- Mania around Pepe ($PEPE) has fallen drastically, with a $250m reduction in market cap over the past two weeks, despite its recent listing on Bitfinex.
Authors
Macro & Crypto Summary – Mike Pozarzycki
Derivatives – Simran Singh
Liquidations – Embert Lin
Altcoins – Simran Singh
This material is provided by GSR (the “Firm”) solely for informational purposes, is intended only for sophisticated, institutional investors and does not constitute an offer or commitment, a solicitation of an offer or commitment, or any advice or recommendation, to enter into or conclude any transaction (whether on the terms shown or otherwise), or to provide investment services in any state or country where such an offer or solicitation or provision would be illegal. The Firm is not and does not act as an advisor or fiduciary in providing this material.
This material is not a research report, and not subject to any of the independence and disclosure standards applicable to research reports prepared pursuant to FINRA or CFTC research rules. This material is not independent of the Firm’s proprietary interests, which may conflict with the interests of any counterparty of the Firm. The Firm trades instruments discussed in this material for its own account, may trade contrary to the views expressed in this material, and may have positions in other related instruments.
Information contained herein is based on sources considered to be reliable, but is not guaranteed to be accurate or complete. Any opinions or estimates expressed herein reflect a judgment made by the author(s) as of the date of publication, and are subject to change without notice. Trading and investing in digital assets involves significant risks including price volatility and illiquidity and may not be suitable for all investors. The Firm is not liable whatsoever for any direct or consequential loss arising from the use of this material. Copyright of this material belongs to GSR. Neither this material nor any copy thereof may be taken, reproduced or redistributed, directly or indirectly, without prior written permission of GSR.
