MACRO + CRYPTO SUMMARY
The last few weeks witnessed a bevy of macro data releases. The first was a higher-than-expected PPI report, followed by somewhat mixed FOMC minutes. A day later came the hot CPI release, which was 0.1% above expectations and showed a hefty 8.2% year-over-year increase in headline inflation, causing risk-off in the markets. The DXY and yields increased, market participants priced in a 20% chance of a 100 bps Fed hike in November, and gold, crypto, and stocks fell materially. Negative performance reversed, however, when the ECB put out a lower-than-expected terminal rate projection, which caused stocks to rip higher and erase the losses following the CPI report. Makes total sense. I mean, it is not like central banks are bad at forecasting or anything.
The broader markets have been rather unremarkable since then, with a slight risk on bent and a few bouts of action here and there. The BOJ once again intervened in the currency markets to prop up the JPY, causing some punchy-looking hourly candles. The UK said goodbye to newly-elected Prime Minister Truss after just 45 days in office, giving way to Rishi Sunak, who now gets a go. And finally just this past weekend, Chinese President Xi tightened his grip on power, causing stocks in the country to crash (the Hang Seng fell 6% to a 13-year low) and the pressure on CNH to continue (CNH hit a record of 7.31).
Market participants will now turn their attention to next week’s FOMC meeting. Even though there are theoretically a lot of pressure points in the markets, the general pattern in the FX and crypto markets has been that of sharply sinking realized volatility, which may persist at least until the Fed meeting.
RATES, FUNDING & BASIS
As mentioned in previous OTC commentary, the disconnect between the “risk-free” rate in crypto and traditional financial markets continues to grow. Persistent hot inflation readings and hawkish central bank rhetoric have resulted in the 3-month USD T-bill rate pushing north of 4%, while stablecoin deposit rates for USDC in DeFi are sub-1%.
U.S. 3-Month Treasury Yield
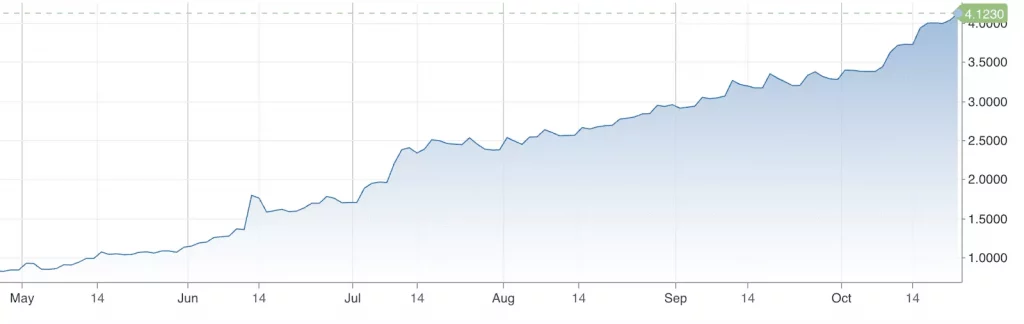
Source: CNBC, GSR
USDC Supply APR on Aave
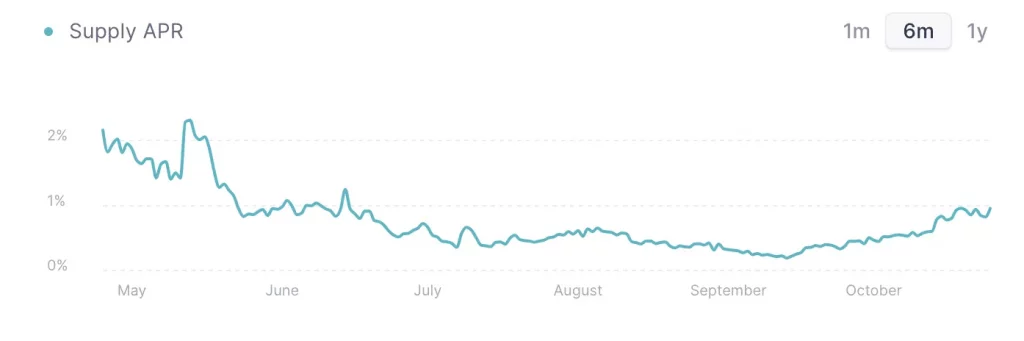
Source: Aave, GSR
The continued widening of this spread may ultimately result in some amount of arbitrage capital leaving crypto in the form of stablecoin redemptions to attain the higher yields on offer in traditional finance. Given the above, the fact that a spread of this magnitude persists speaks to the substantial portion of capital in the space seeking a “safe haven” outside of traditional financial markets.
In perpetual swaps, BTC and ETH rates have remained marginally negative, which is consistent with the aforementioned low stablecoin rates in DeFi. The persistence of negative funding rates speaks to the bearish net positioning in the market from hedging and speculative interests. As the bear market has dragged on, participants have stepped up hedging programs, which in turn pressure funding rates lower.
BTC Eight-Hour Perpetual Funding Rate
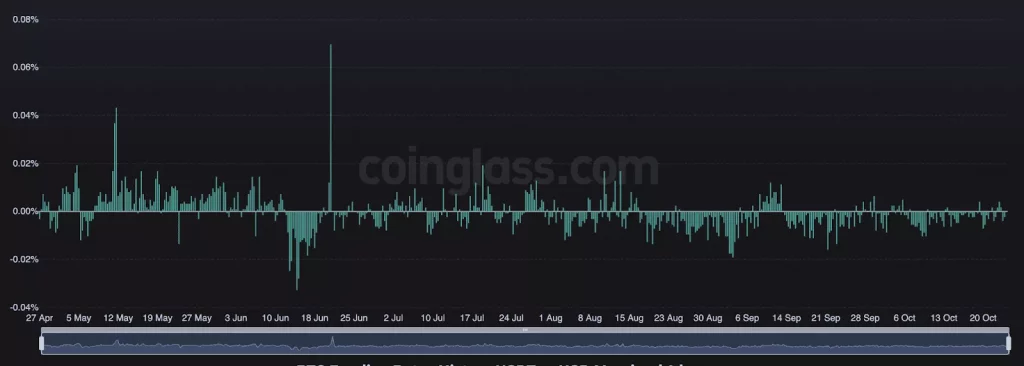
Source: FTX, GSR
DERIVATIVES
BTC Derivatives
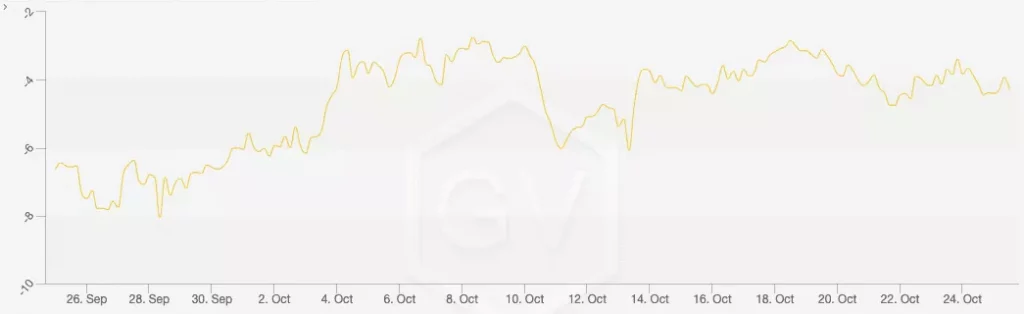
BTC implied volatility continues to trend lower with 30-day IV at 56% and 7-day IV at 46%. Until there is a convincing break away from the current $19,000 range for BTC, the decline in implied volatility may continue, and one could even argue that current levels are overpriced compared to realized volatility, with realized volatility at just 20%.
BTC 30 Day ATM Implied Volatility
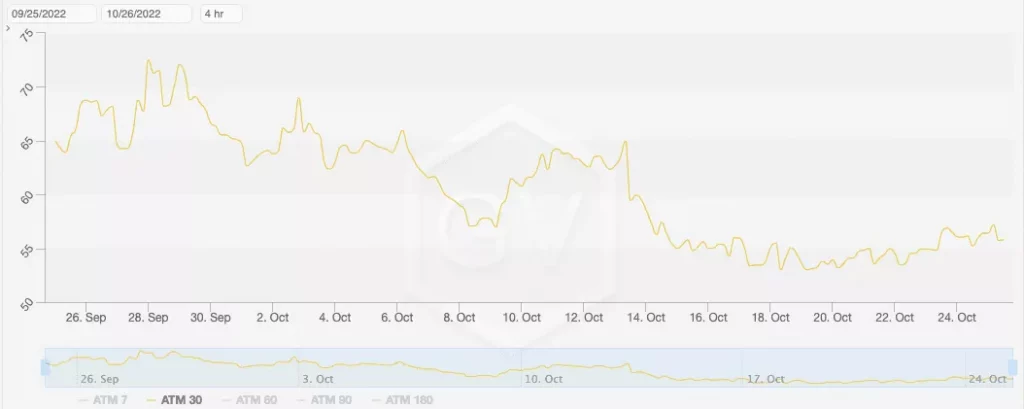
Source: Genesis Volatility, GSR
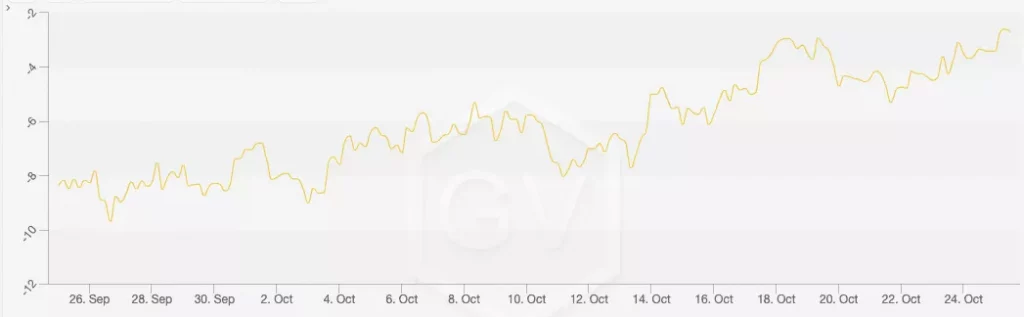
Call skew (measured C-P) at the 35 delta level has been trending higher recently, up from -8.0% to roughly -3.8%, indicating an increased demand for calls potentially due to expectations of an upside breakout given strong support at $18,000.
BTC 35 Delta Call Skew
Source: Genesis Volatility, GSR
While term structure is in contango and realized volatility in the near-term continues to remain suppressed, implied volatility suggests a potential reversion higher into year-end as the 30DEC22 expiry trades at an 8 IV premium to the 04NOV22 expiry.
BTC Term Structure
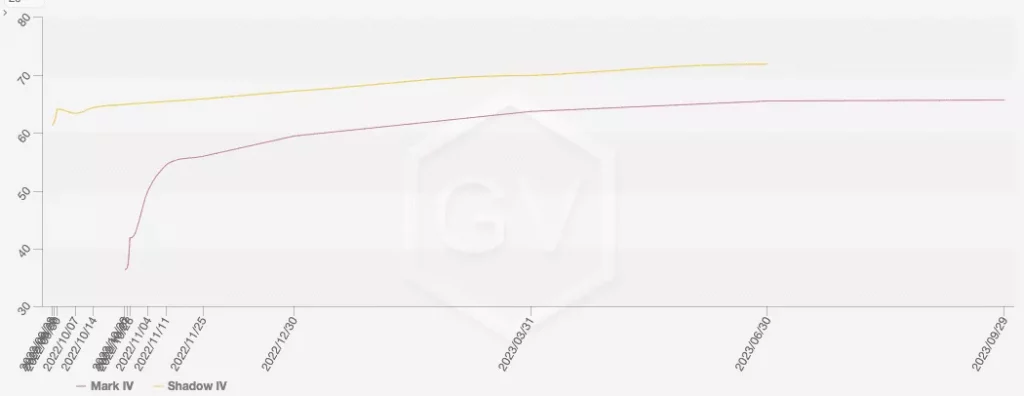
Source: Genesis Volatility, GSR
ETH Derivatives
ETH realized volatility is currently at 36%, almost two times that of BTC despite this ratio typically being much lower, usually around 1.3x. 30 day implied volatility is approaching yearly lows, currently at 67% compared to the low of 60% in April.
ETH 30 Day ATM Implied Volatility
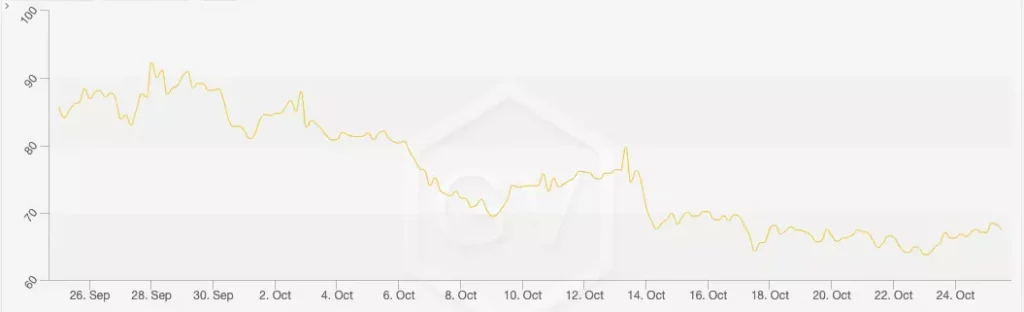
Source: Genesis Volatility, GSR
The 35 delta call skew has trended higher, although the 35 delta call still trades at an IV discount to the 35 delta puts and term structure exhibits a similar story to that of BTC.
ETH Term Structure
Source: Genesis Volatility, GSR
ETH Skew
Source: Genesis Volatility, GSR
FLOWS AND LIQUIDATIONS
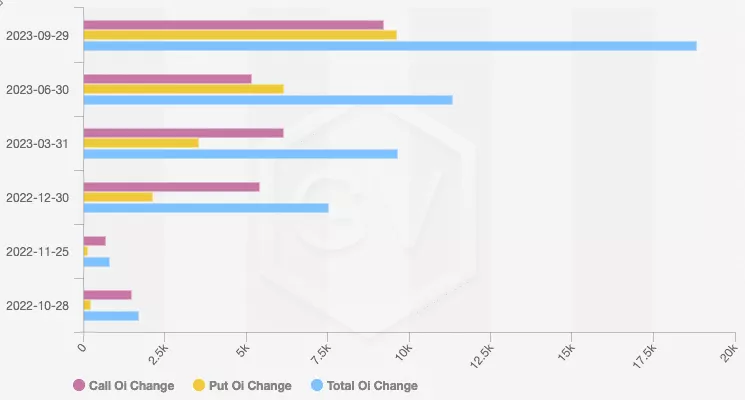
The past two weeks have been relatively uneventful with mainly range-bound trading and few liquidations. Interestingly, there has been a large amount of open interest in longer-dated expiries in the June-September 2023 tenor, both for BTC and ETH.
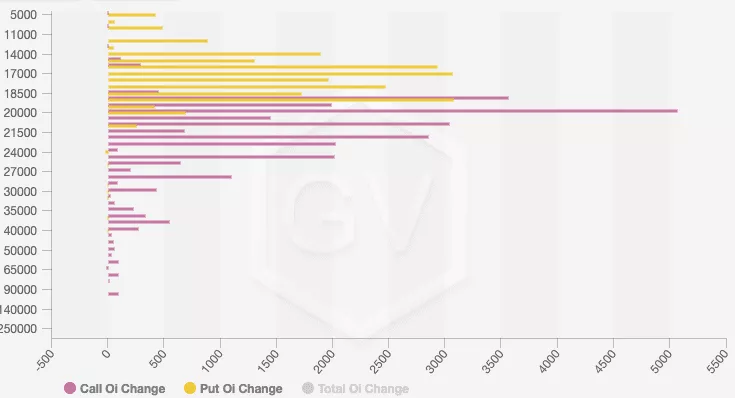
In BTC, calls with 19,000, 20,000, and 21,000 strikes have seen the greatest increase in open interest, while the greatest OI increase for puts has been in the 16,000 to 19,000 strike range. Also, note the imbalance between calls and puts for BTC, with particularly large amounts of call open interest blocked at the December 30th expiry.
BTC Historical OI Change By Expiration
Source: Genesis Volatility, GSR
BTC Historical OI by Strike
Source: Genesis Volatility, GSR
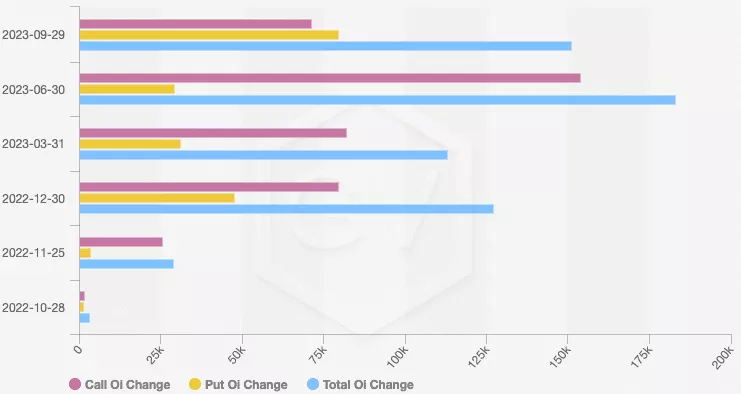
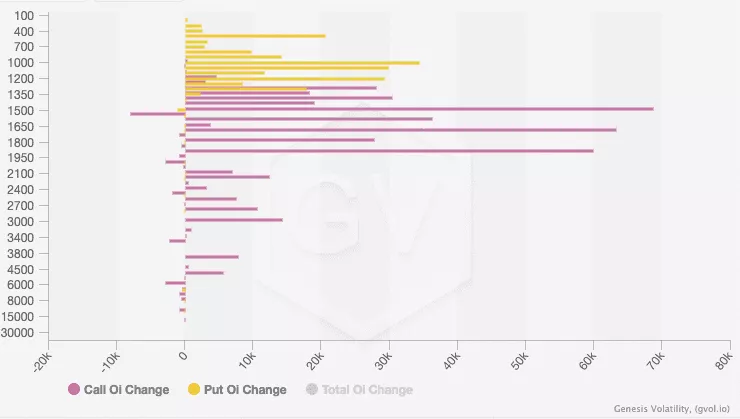
In ETH, the greatest increase in open interest has been in the 1,500, 1,700, and 1,900 strikes for calls, and in the 500 and 1,000 strikes for puts. There is also a noticeable imbalance in open interest with calls being dominant in all tenors other than September 2023.
ETH Historical OI Change By Expiration
Source: Genesis Volatility, GSR
ETH Historical OI Change by Strike
Source: Genesis Volatility, GSR
Liquidations have remained relatively tame with the most notable exceptions over the past two weeks occurring on October 12th and 13th where a combined $260m in longs and $160m in shorts were liquidated. Last week saw a tick-up in average long liquidations, but this is relatively unnoticeable compared to the larger liquidations in September and October.
DeFi
Recent events in DeFi have reminded us that it is necessary to continuously evaluate the risks of participating in such protocols. Mango Markets was the latest victim of an exploit that saw the protocol completely drained of its insurance fund (after the exploiter returned some of the funds). It is necessary to continuously evaluate risk parameters with each and every asset with platforms that allow cross-collateralization in a range of assets, as one bad apple may bring down the rest. In Mango’s case, their native MNGO token had fallen enough in price and liquidity for the oracle price to be manipulated, allowing the exploiter to use unrealized PnL from another account to withdraw all assets from the platform. Subsequently, we also saw the same style of attack on Moolah Markets, a borrow-lend platform on the Celo blockchain.
Elsewhere, Aptos successfully launched last Tuesday, with its APT token instantly becoming one of the most traded across all exchanges. On-chain DeFi applications are now scaling up, likely making it an opportune ecosystem for trading and other DeFi strategies.
Authors
Mike Pozarzycki – Macro & Crypto Summary
Spencer Hallarn – Rates, Funding and Basis
John Cole – Derivatives
Christopher Newhouse – Flows and Liquidations
Calvin Weixuan Goh – DeFi
This material is provided by GSR (the “Firm”) solely for informational purposes, is intended only for sophisticated, institutional investors and does not constitute an offer or commitment, a solicitation of an offer or commitment, or any advice or recommendation, to enter into or conclude any transaction (whether on the terms shown or otherwise), or to provide investment services in any state or country where such an offer or solicitation or provision would be illegal. The Firm is not and does not act as an advisor or fiduciary in providing this material. This material is not a research report, and not subject to any of the independence and disclosure standards applicable to research reports prepared pursuant to FINRA or CFTC research rules. This material is not independent of the Firm’s proprietary interests, which may conflict with the interests of any counterparty of the Firm. The Firm trades instruments discussed in this material for its own account, may trade contrary to the views expressed in this material, and may have positions in other related instruments.Information contained herein is based on sources considered to be reliable, but is not guaranteed to be accurate or complete. Any opinions or estimates expressed herein reflect a judgment made by the author(s) as of the date of publication, and are subject to change without notice. Trading and investing in digital assets involves significant risks including price volatility and illiquidity and may not be suitable for all investors. The Firm is not liable whatsoever for any direct or consequential loss arising from the use of this material. Copyright of this material belongs to GSR. Neither this material nor any copy thereof may be taken, reproduced or redistributed, directly or indirectly, without prior written permission of GSR.
