Author: Brian Rudick, Senior Strategist
In this Chart of the Week, we review cryptocurrency derivatives basics, how to interpret various crypto derivatives metrics, and analyze what they may imply for sentiment.
Derivatives Basics: Derivatives are financial contracts between two or more parties that derive their value from the price of an underlying asset or benchmark. Derivatives are used to manage risks via hedging or to speculate and generate leverage, and alleviate the need for the investor to custody the underlying digital assets. While traditional finance includes forwards and swaps, there are three main types of derivatives prevalent in crypto today:
- Futures: Futures are financial contracts obligating the buyer to buy and the seller to sell the underlying asset at an agreed upon price at a future date. Futures contracts are standardized, trade on exchanges, and can be settled physically or in cash.
- Perpetual Swaps: Perpetual swaps are similar to futures except they don’t expire. Whereas futures prices converge to spot prices as expiration nears, perpetuals use a funding mechanism to tether contracts to their underlying spot price.
- Options: Options give the holder the right, but not the obligation, to buy (a call option) or sell (a put option) an asset for a specific price called the strike price on, and sometimes before, a predetermined future date. Option prices are determined by the price of the underlying asset, the strike price, the time to expiration, the volatility of the underlying asset, and interest rates. Options traders often monitor risk measures called the Greeks, which measure the change in option prices in response to changes in underlying variables, such as the underlying asset price (called delta), the change in delta due to the change in the underlying (gamma), the change in volatility (vega), and the change in time remaining (theta).
Futures & Perpetuals Metrics & Signals: Crypto futures and perpetual swaps allow investors to bet on future prices without needing to own the underlying asset, to do so with greater leverage than what’s achievable in the spot market, and with margining in crypto instead of fiat. As such, perpetuals in particular have become the dominant vehicle for gaining exposure to crypto with greater trading volume and open interest than in each of the other categories. The largest exchange for these instruments by both volume and open interest is Binance, though other major players include Bybit, FTX, CME, OKEx, and Huobi. Popular futures and perpetuals metrics include:
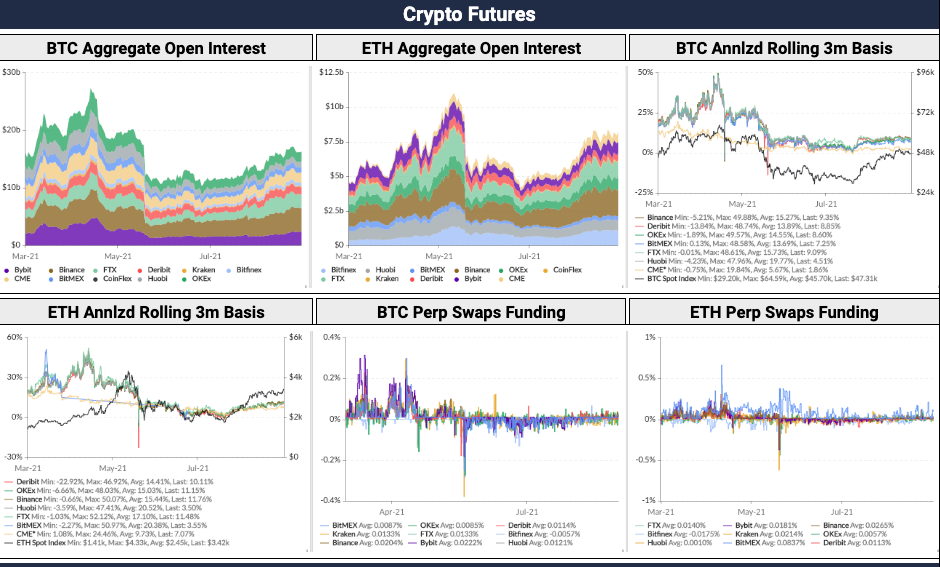
- Open Interest: Open interest measures the amount of a particular derivatives contract in existence at a given time. While open interest for options is more nuanced, given multiple expiries/strike prices and the ability to buy both puts and calls, futures OI is a measure of capital flows that when combined price and volume trends can be particularly insightful. For example, the gradually increasing futures and perpetuals OI since mid-May shown in Exhibit 1 combined with BTC’s rising price suggests new money is coming into the space, which is a positive sign (though note that if OI and prices rise too fast, it can be a sign of exuberance and act as a contrarian indicator).
- Futures Basis: The basis is the relative difference between the price of the futures contract and the spot price. In a healthy market, futures prices will trade above spot prices, often with a 5%-15% annualized premium, in what’s known as contango. However, in bear markets, the premium can be lower or even negative, a situation called backwardation. As shown in the exhibit, the basis for both BTC and ETH looked extended in April, portending the decline in prices, though bases for both BTC and ETH more recently are in normal ranges, suggesting a healthy market.
- Funding Rates: Since perpetual swaps don’t expire, exchanges use a funding rate to tether their price to the price in the spot market. If the perpetual contract price is higher than the spot price, the funding rate is positive and longs pay shorts. If the perpetual contract price is lower than the spot price, the funding rate is negative and shorts pay longs. A positive funding rate typically indicates bullish sentiment, while a negative funding rate indicates the opposite. That said, since the open interest from perpetual buyers and sellers match at all times but leverage can vary, funding rates can be thought of as how willing traders are to pay up for leverage. As a result, funding rates at extremes can be contrarian indicators, as, for example, a small correction during a time when funding rates are excessively high can lead to cascading liquidations and a material drop in the underlying crypto’s price. Lastly, combining funding rates with futures basis can be informative, such as when funding rates are low but the futures basis has bottomed may indicate sentiment and therefore price may inflect upward. Currently, funding rates are slightly positive, between 0.01% and 0.02%, far from the extremes but indicating bullish momentum.
Options Metrics & Signals: Like other financial derivatives, options allow traders to hedge or speculate on prices, but unlike other derivatives types, options limit losses for call and put holders to the amount paid for the option, called the premium. Crypto options trading is dominated by institutions, but is becoming increasingly popular with retail traders. Roughly 90% of crypto options trading occurs on Deribit, though exotic options do trade OTC. Popular options metrics include:
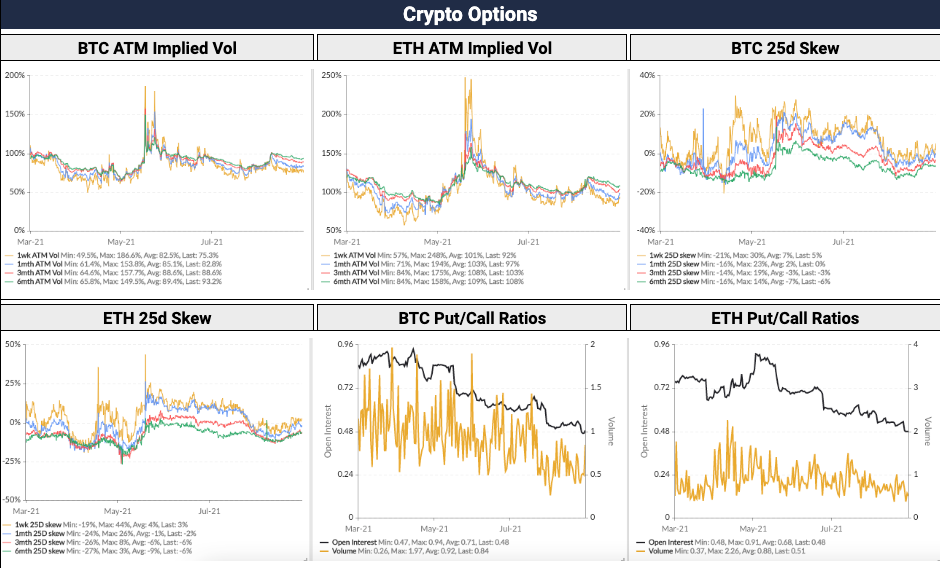
- Implied Volatility: Implied volatility measures investors’ expectations of future volatility of the underlying asset over the lifetime of the option, and is backed into using current options prices and an options pricing model such as Black-Scholes. Implied volatility makes it easier to compare options with different strike prices and expiries, and can be thought of as an abstraction for time value. Importantly, implied volatility doesn’t show which way the underlying price may go, just how large the market’s expectation of movement is. Implied volatility usually increases in bearish markets and decreases in bullish markets. As shown below, IVs were particularly high in late May during China’s mining clampdown, but generally fell as mining hash rates recovered and the market became more optimistic. More recently, IVs for both BTC and ETH rose around mid-August when the US Senate failed to modify the crypto tax provision in the bipartisan infrastructure bill, but have since trended downward suggesting the market is not quite as confident as prior to the crypto tax provision, but is less worried than when the news was at a fever pitch.
- Skew: Recall that delta measures the percentage change in the price of an option relative to the percentage change in the underlying, and can alternatively be thought of as the probability that the option expires in-the-money (i.e. the price is above the strike price for a call option, or below the strike price for a put option). Skew simply measures the relative richness of bets, measured as implied volatility, on puts compared to calls with the same time to expiration and delta, most commonly -/+25%. Positive skew means the market is willing to pay up to own downside bets vs. upside bets and suggests investors may be pessimistic. Negative skew, by contrast, suggests optimism as investors are willing to pay more to bet on prices rising than falling. Both BTC and ETH 25d skew was most positive in late May, again suggesting a bearish sentiment, but has generally fallen to suggest improved sentiment relative to that of recent months.
- Put/Call Ratio: The put/call ratio measures the total open interest for put options compared to call options. A rising put/call ratio signals increasingly bearish sentiment, while a falling put/call ratio indicates improving sentiment. That said, the put/call ratio can be used as a contrarian indicator when at extremes, potentially signalling a coming reversal. As shown in the exhibit, both BTC and ETH put/call ratios have been generally trending down over the last six months, indicating more positive sentiment.
Crypto Derivatives Experts: GSR specializes in providing liquidity, risk management strategies and crypto structured products to sophisticated global investors in the digital asset industry. We provide over $1 billion worth of liquidity to the crypto markets on a daily basis, and we trade over 200 digital assets across spot, futures and options. We offer deep liquidity via access to numerous liquidity pools, an established network of crypto OTC desks, and our global banking connections; unparalleled pricing via Smart Order Execution which finds unrivalled liquidity and prices across a wide range of market participants and exchanges; and, customizable solutions, with tailored, flexible algorithmic execution strategies. For further information on how we can help, please contact markets@gsr.io.
Exhibit 1: Options and Derivatives Metrics, as of August 31, 2021


Source: Skew, GSR
To download this article as a pdf click here.
This material is a product of the GSR Sales and Trading Department. It is not a product of a Research Department, not a research report, and not subject to all of the independence and disclosure standards applicable to research reports prepared pursuant to FINRA or CFTC research rules. This material is not independent of the Firm’s proprietary interests, which may conflict with your interests. The Firm trades instruments discussed in this material for its own account. The author may have consulted with the Firm’s traders and other personnel, who may have already traded based on the views expressed in this material, may trade contrary to the views expressed in this material, and may have positions in other instruments discussed herein. This material is intended only for institutional investors. Solely for purposes of the CFTC’s rules and to the extent this material discusses derivatives, this material is a solicitation for entering into a derivatives transaction and should not be considered to be a derivatives research report.This material is provided solely for informational purposes, is intended for your use only and does not constitute an offer or commitment, a solicitation of an offer or comment (except as noted for CFTC purposes), or any advice or recommendation, to enter into or conclude any transaction (whether on the indicative terms shown or otherwise), or to provide investment services in any state or country where such an offer or solicitation or provision would be illegal.Information is based on sources considered to be reliable, but not guaranteed to be accurate or complete. Any opinions or estimates expressed herein reflect a judgment made as of the date of publication, and are subject to change without notice. Trading and investing in digital assets involves significant risks including price volatility and illiquidity and may not be suitable for all investors. GSR will not be liable whatsoever for any direct or consequential loss arising from the use of this Information. Copyright of this Information belongs to GSR. Neither this Information nor any copy thereof may be taken or rented or redistributed, directly or indirectly, without prior written permission of GSR. Not a solicitation to U.S. Entities or individuals for securities in any form. If you are such an entity, you must close this page.

