Understanding the Perils (and Potential) of Leveraged ETFs
With the approval of the first 2x leveraged Bitcoin Futures ETF, we dive into the plumbing of leveraged ETFs and the factors contributing to their frequently misunderstood performance.

While most investors are familiar with leverage and its ability to amplify returns at the cost of added risk, many base their understanding of leverage on traditional margin loans. In the case of such loans, an investor with $100 of equity in their brokerage account may borrow, for example, an additional $100 of capital from their broker, yielding a total purchasing power of $200. Overlooking the cost of the margin loan, a 2x margin investor will earn twice the cumulative return of the underlying investment, regardless of their holding period or investment horizon. Suppose the underlying asset rises 50% over any arbitrary period and the margin position is not liquidated along the way. In such a scenario, the 2x margin investor will earn twice that of the underlying asset or 100%, regardless of whether the gains occurred over days, months, or years. On the other hand, leveraged ETFs, like the recently approved 2x leveraged Bitcoin Futures ETF, do not share this trait and only seek to generate twice the returns of the underlying over a single-day holding period. In fact, when the holding period extends beyond a day, leveraged ETFs may paradoxically fall in value despite gains in the underlying. Leveraged ETFs have been the subject of much consternation in traditional finance for this reason, but they also have the potential to generate staggering gains under particular circumstances, far more than would be naively inferred from their stated leverage multiple (i.e., returns greater than the underlying’s return multiplied by the leverage multiple). As a result, real examples of leveraged ETFs have ranged from complete wipeouts to staggering success stories, some of which we detail in the appendix. The remainder of this report delves into the complexities of leveraged ETFs, underscoring the differences between leveraged ETFs and margin positions and illuminating the key factors that influence the performance of leveraged ETFs versus naive expectations.
In the vast majority of cases, leveraged ETFs, including the recently launched 2x leveraged bitcoin futures ETF, invest in derivatives aiming to generate a constant multiple (e.g., -2x, 2x, 3x, etc.) of the underlying’s daily returns before fees.1 However, since the leverage multiple of a passive portfolio fluctuates with market movements, leveraged ETFs must be rebalanced each day to maintain their constant leverage target. As the price of the underlying rises or falls, the leveraged investor’s equity value would rise or fall by a greater percentage than that of the total portfolio, changing the portfolio’s leverage and requiring it to be reset at the market close. This rebalancing leads to a common source of misunderstanding, namely that leveraged ETFs typically do not generate a constant multiple of the underlying’s cumulative return over a multi-day investment horizon, and performance can vary drastically from such expectations, for better or worse, depending on several variables, including the underlying’s performance, its volatility, the leverage target, and the investment horizon. Leveraged ETFs are typically marketed as an instrument for short-term traders as opposed to investors for this reason. Conversely, the leverage profile of a 2x margin position that’s passively managed without daily rebalancing will maintain a fixed amount of debt in dollar terms, causing its leverage multiple to deviate from its 2x starting point as the market moves. Resultantly, the margin position will not generate twice the market’s daily return after the first day, but it will generate twice the return of the market on a cumulative basis over the entire holding period.2 Given that most investors assess performance based on cumulative returns over months or years, the discrepancy in realized performance between leveraged ETFs and alternative margin-based positions can often surprise them over such periods.

Source: GSR. Note: Measures the realized leverage factor (i.e., the return of the leveraged product divided by the return of the unleveraged product – TQQQ/QQQ and SOXL/SOXX) over various investment horizons. As intended, the daily leverage factor corresponds closely with the targeted 3x leverage over a daily holding period, but the realized leverage factor routinely deviates from this – above and below – as the holding period increases. Lastly, each data point represents a one-month median of the realized 1D, 1M, and 5Y leverage factors in an attempt to mitigate the effect of periods where the underyling’s return (denominator) is very close to zero.
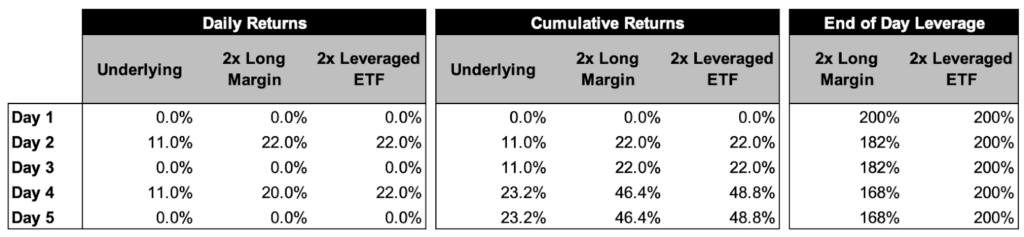
Leveraged ETFs grapple with a phenomenon known as the constant leverage trap. Consider a volatile two-day period where the underlying rises by 25% before falling 20% the next day. The value of the underlying and the portfolio leveraged with margin remain unchanged [(1+0.25)*(1-0.2)=1], while the leveraged ETF targeting 2x the daily return falls by 10% cumulatively [(1+0.5)(1-0.4)=0.9]. This phenomenon stems from the ETFs’ constant leverage target that mandates an increase (decrease) in exposure as the underlying moves upward (downward), giving rise to a buy high, sell low trading strategy that can exacerbate volatility in its own right. This example also highlights the path dependency of leveraged ETFs, which are not just dependent on the underlying’s cumulative return but also the path taken to realize that return (i.e., each individual daily return). Modulating the volatility in our previous example, let’s assume the underlying rises by 5% before falling 4.76% the next day. The cumulative return of the underlying remains unchanged at 0%, but the leveraged ETF now only falls 0.5% compared to 10% in the prior example. When daily returns are small and volatility is low, the rebalancing needs of leveraged ETFs are minimal, leading to less cumulative divergence. Ultimately, leveraged ETFs tend to fare poorly in trendless markets characterized by high volatility and mean reversion.


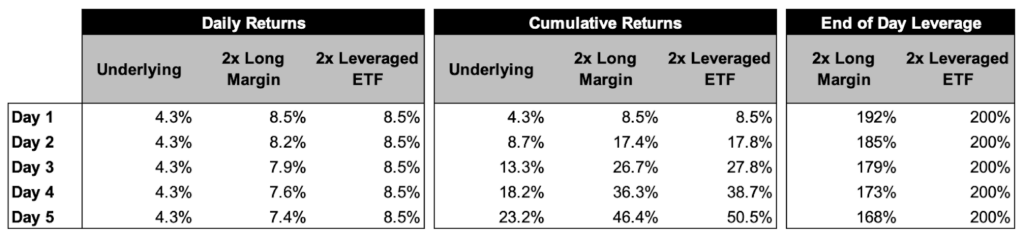
Source: GSR. Note: Data is illustrative based on hypothetical returns. Both a 2x leveraged ETF and a 2x leveraged position established via margin will generate the same returns on day one as they both start with 2x leverage. After a positive day of performance, the equity of the two portfolios will rise by a greater percentage than the total market exposure, so the leverage of each product will fall. However, the 2x leveraged ETF will add exposure at the end of the day to raise this back to 2x for the following day. This behavior results in the leveraged ETF performing better in monotonic, trending markets, regardless of direction, but far worse in range bound, mean reverting markets with high volatility as, illustrated in this example.
On the opposite end of the spectrum, leveraged ETFs outperform when the underlying’s returns are autocorrelated, either rising or falling monotonically. And while a leveraged ETF will still fall sharply on an absolute basis during a consistent market decline, its buy-high, sell-low rebalancing profile will still outperform a margin portfolio in such environments. This outperformance is a result of the margin position’s leverage factor growing each day as the market moves against it. Moreover, even when returns rise or fall monotonically, leveraged ETFs benefit from daily returns that are stable in magnitude relative to equivalent gains or losses that modulate in size each day. This outcome follows from the pro-trend rebalancing process of leveraged ETFs that benefits from compounding during a trend. Said another way, daily gains (losses) will increase (decrease) the leveraged ETF’s exposure to the underlying for all subsequent days, and thus there are compounding benefits to employing constant leverage when markets exhibit a directional trend.
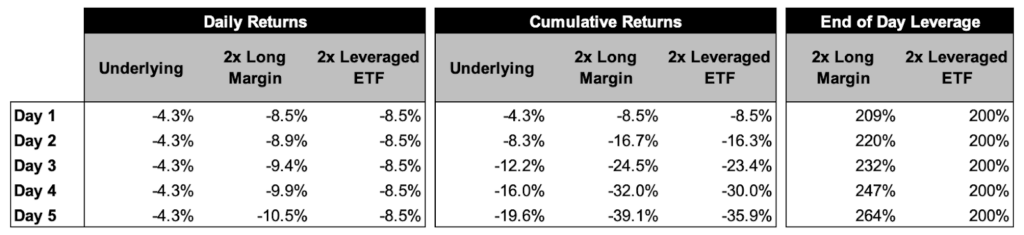
Source: GSR. Note: Data is illustrative based on hypothetical returns. The margin portfolio’s exposure will grow (fall) as markets fall (rise), leading to underperformance versus leveraged ETFs that will rebalance daily to keep their exposure constant.
The cumulative returns of leveraged ETFs can be generalized as a function of the underlying’s return and its squared volatility or variance, the targeted leverage factor, and the length of the holding period. More precisely, the leveraged ETFs holding period return can be approximated as a function of the underlying’s return exponentiated by the leverage factor and multiplied by a scalar term. This scalar term is between zero and one, but it diminishes towards zero with a high leverage factor, a long investment horizon, and a high variance, meaning the leveraged ETFs returns will gravitate towards zero as these variables increase in the absence of an uptrend. This dampening scalar term may be sufficiently offset by a strong directional trend, however, and leveraged ETFs can generate returns far beyond those implied by their leverage factor when the underlying exhibits a strong directional trend. This nuance is particularly important given leveraged ETFs are plagued by a myth that a decline toward zero is destined over a sufficiently long and volatile holding period. Interested readers can explore these tradeoffs under various assumptions in a simplified model here.
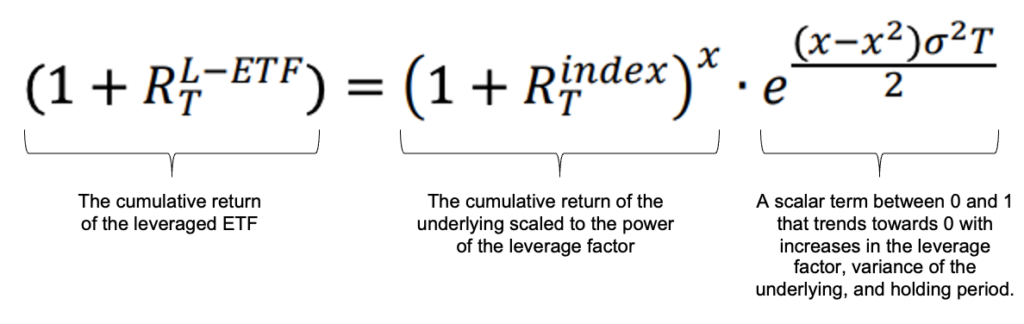
Source: Leveraged ETFs, Holding Periods, and Investment Shortfalls, GSR. x = targeted leverage factor, sigma squared = daily variance of the underlying, and T = number of rebalancing periods (i.e., number of days in this example). RTL-ETF and RTindex represent the cumulative return of the leveraged ETF and the underlying, respectively. The annotations are simplified but technically (1+RTL-ETF) and (1+RTindex) describe the end value of the investment, and thus 1 must be subtracted from each to get the actual cumulative return instead of the end value which includes starting principal.
Understanding the structure of leveraged ETFs and their return drivers may assist investors in more accurately assessing the merits of their use.3,4 Revisiting the example of the recently launched 2x Leveraged Bitcoin Futures ETF (BITX), investors planning to hold for more than one day must be extremely confident in their directional forecasts. Otherwise, their position will rapidly decay as it rebalances amidst the extreme volatility of the underlying Bitcoin Futures contracts. Alternatively, investors seeking leveraged bitcoin exposure without such strong short-term directional conviction might prefer to purchase an unleveraged Bitcoin Futures ETF using margin. This alternative approach can help mitigate the path dependency introduced by the daily rebalancing in the leveraged ETF.
Given the lack of performance history for the newly launched 2x Leveraged Bitcoin Futures ETF, we evaluate the realized performance of several other leveraged ETFs spanning various volatility profiles, leverage targets, and investment holding periods. Performance is evaluated relative to an equivalent unleveraged ETF, and each product’s cumulative return is evaluated since inception, ranging from several years to several decades. Specifically, we look at a 2x Leveraged S&P 500 mutual fund (ULPSX), a 3x Leveraged Nasdaq 100 ETF (TQQQ), and a 3x Leveraged Biotech ETF (LABU). These three products nicely illustrate the drastically different outcomes enabled by such volatile investment vehicles. Lastly, we include the first month of realized results for the recently launched 2x Leveraged Bitcoin Futures ETF (BITX).
The S&P 500 example begins in December 1997 and best illustrates an equity investment over a multicycle investment horizon. The holding period is characterized by a long-term uptrend with substantial volatility along the way, including the dot com bubble, the 2008 financial crisis, and COVID-19. While the 2x Leveraged S&P 500 fund (ULPSX) delivered positive returns over this period, it underperformed its unleveraged equivalent despite being twice as volatile.

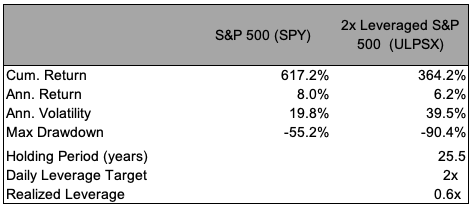
Source: GSR, finance.yahoo data from Dec. 1997 to June 2023. The ULPSX mutual fund was used for a longer performance history since leveraged ETFs only came to fruition in 2006.
The Nasdaq example illustrates the best-case scenario for a leveraged ETF, an underlying with incredibly strong performance relative to its realized volatility over the period examined. The 3x Leveraged Nasdaq 100 ETF (TQQQ) was fortunate to launch shortly after the financial crisis into a nearly monotonic up trend for the first ten years of its life. Even after accounting for an 81% drawdown as technology stocks sold off in 2022, the fund has still delivered a staggering ~11.1x multiple of the Nasdaq 100’s return since its February 2010 inception. At its peak, the fund delivered a ~205x return on investment before its 2022 drawdown.
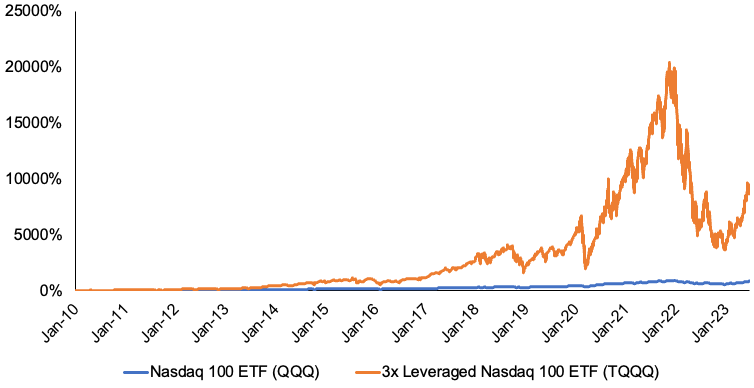
Source: GSR, finance.yahoo data from Feb. 2010 to June 2023.
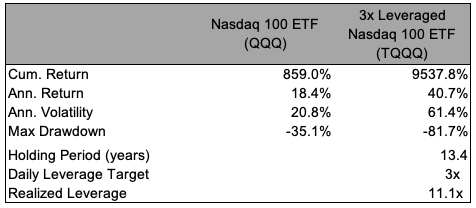
The S&P Biotech example illustrates the worst-case scenario for a leveraged ETF, a highly volatile market that’s virtually flat over the examined holding period beginning in May 2015. While the underlying realized a modest 9.5% cumulative gain over the investment horizon, the 3x Leveraged ETF (LABU) lost nearly its entire value, falling 96%. And while we don’t delve much into inverse products in this report for simplicity, this is the prime example of where leveraged and inverse products fail to deliver. The 3x Inverse ETF (LABD) fared even worse here, losing 99.8% of its value.
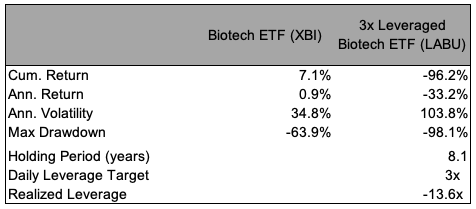
Source: GSR, finance.yahoo data from May 2015 to June 2023.
Lastly, we include Bitcoin Futures data for completeness despite only having a single month of realized performance.
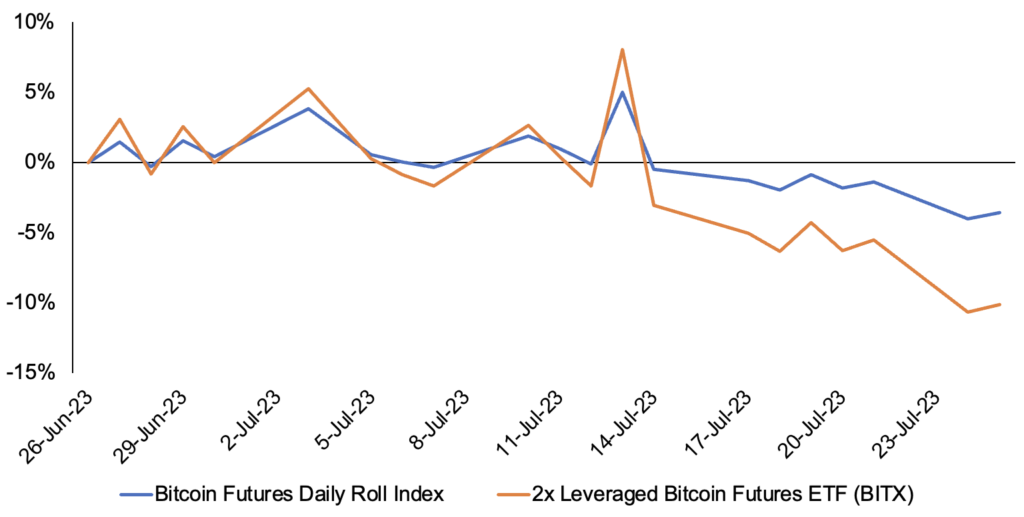
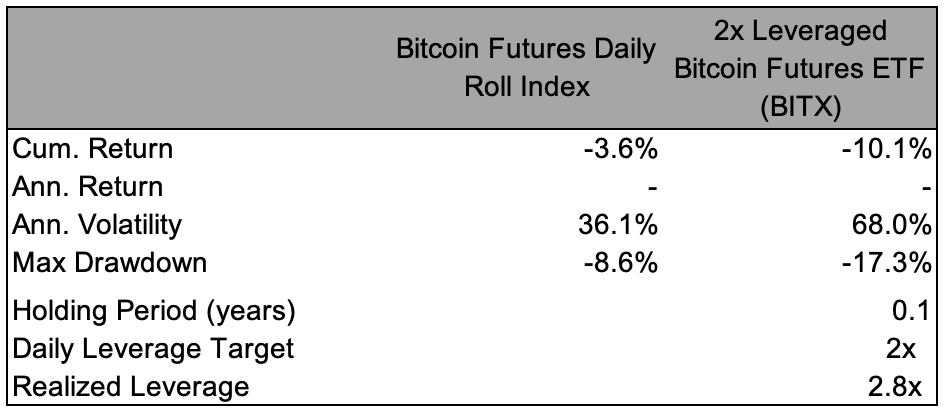
Source: GSR, finance.yahoo, S&P Global, data from June 27, 2023 to July 25, 2023.
Matt Kunke, Research Analyst | Twitter, Telegram, LinkedIn
Brian Rudick, Senior Strategist | Twitter, Telegram, LinkedIn
Long-Term Investing in Triple Leveraged Exchange Traded Funds, Leveraged ETFs, Holding Periods and Investment Shortfalls, Do Leveraged Exchange-Traded Products Deliver Their Stated Multiples?, Solving the Return Deviation Conundrum of Leveraged Exchange-Traded Funds, Leveraged ETFs: Don’t Get Wiped Out by the Tail, The Lowdown on Leveraged and Inverse ETPs – FINRA, Leveraged and Inverse ETPs: Going, Going, Gone? – Schwab
This material is provided by GSR (the “Firm”) solely for informational purposes, is intended only for sophisticated, institutional investors and does not constitute an offer or commitment, a solicitation of an offer or commitment, or any advice or recommendation, to enter into or conclude any transaction (whether on the terms shown or otherwise), or to provide investment services in any state or country where such an offer or solicitation or provision would be illegal. The Firm is not and does not act as an advisor or fiduciary in providing this material. GSR is not authorised or regulated in the UK by the Financial Conduct Authority. The protections provided by the UK regulatory system will not be available to you. Specifically, information provided herein is intended for institutional persons only and is not suitable for retail persons in the United Kingdom, and no solicitation or recommendation is being made to you in regards to any products or services. This material is not a research report, and not subject to any of the independence and disclosure standards applicable to research reports prepared pursuant to FINRA or CFTC research rules. This material is not independent of the Firm’s proprietary interests, which may conflict with the interests of any counterparty of the Firm. The Firm trades instruments discussed in this material for its own account, may trade contrary to the views expressed in this material, and may have positions in other related instruments.Information contained herein is based on sources considered to be reliable, but is not guaranteed to be accurate or complete. Any opinions or estimates expressed herein reflect a judgment made by the author(s) as of the date of publication, and are subject to change without notice. Trading and investing in digital assets involves significant risks including price volatility and illiquidity and may not be suitable for all investors. The Firm is not liable whatsoever for any direct or consequential loss arising from the use of this material. Copyright of this material belongs to GSR. Neither this material nor any copy thereof may be taken, reproduced or redistributed, directly or indirectly, without prior written permission of GSR.