MACRO SUMMARY
Markets around the globe continue to focus on inflation and its potential ramifications for monetary policy, with supportive news on this front out of Europe earlier this week. While the ECB announced its tenth consecutive rate hike to a record 4.0% and revised its 2023 inflation projection higher, it also suggested that rate hikes are likely done for now, stating “…the Governing Council considers that the key ECB interest rates have reached levels that, maintained for a sufficiently long duration, will make a substantial contribution to the timely return of inflation to the target”.
The situation in the US is a bit less clear as Fed Chair Powell took a measured tone at the Jackson Hole Economic Symposium three weeks ago, but recent inflation readings have not presented a decisive trend. Per the PCE, the Fed’s preferred inflation gauge, prices rose by 3.3% and 4.2% in July over the prior year on a headline and core basis, both accelerating from the prior month but in line with the consensus. Although headline CPI and PPI saw August price growth come in hotter than expected, both core measures (which exclude energy and food prices) were inline with forecasts.
Core PCE Inflation, Year-over-year Percent Change
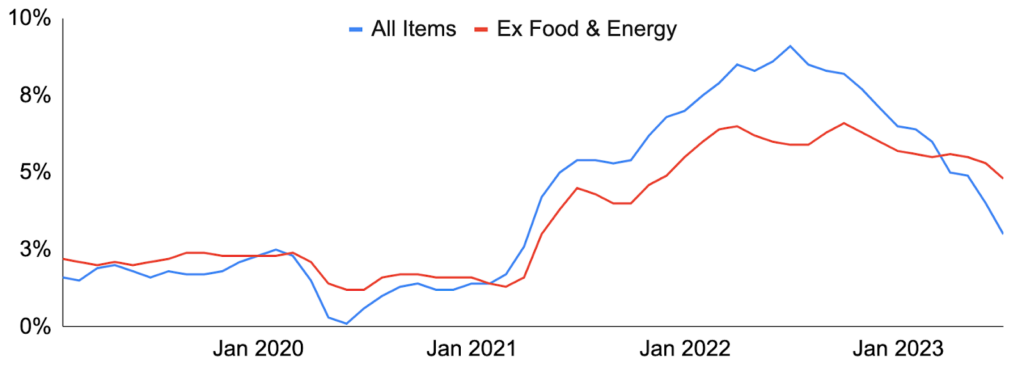
Source: Bureau of Economic Analysis, GSR.
All eyes now turn to the Fed’s meeting on Tuesday and Wednesday, where Fed Funds futures assign a 97% chance to the Fed maintaining current rates despite June’s Summary of Economic Projections (SEP) showing an expected year-end Fed Funds rate of 5.6%, implying one more rate hike from the current 5.25-5.50% target range. Additionally, the SEP and post-meeting press conference may provide clues around the Fed’s longer-term plans, where futures markets suggest a “higher for longer” scenario with no easing priced in (with greater than 50% likelihood) until 2Q 2024.
Probabilities of Fed Rate Decision
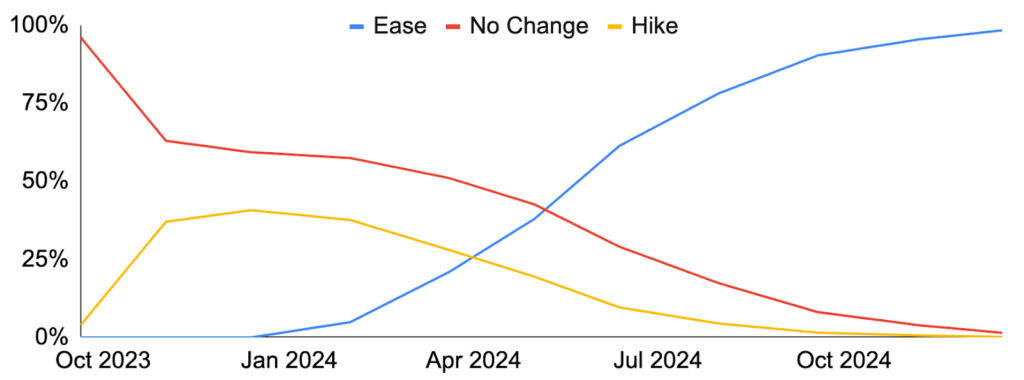
Source: CME, GSR.
DERIVATIVES LANDSCAPE
After implied and realized vols for BTC and ETH reached near historic lows – prompt ATM vols implied in the mid-20% to low-30% – with a consistent grind down for most of the summer, the vol market saw a noticeable pick up in interest after the sharp selloff in mid-August. This caused an intraday rally in the BVIV and EVIV indexes of 19 and 29 points, respectively, ranking in the ~99th percentile of intraday moves since Volmex began publication.
Bitcoin and Ether Implied Volatility Indexes
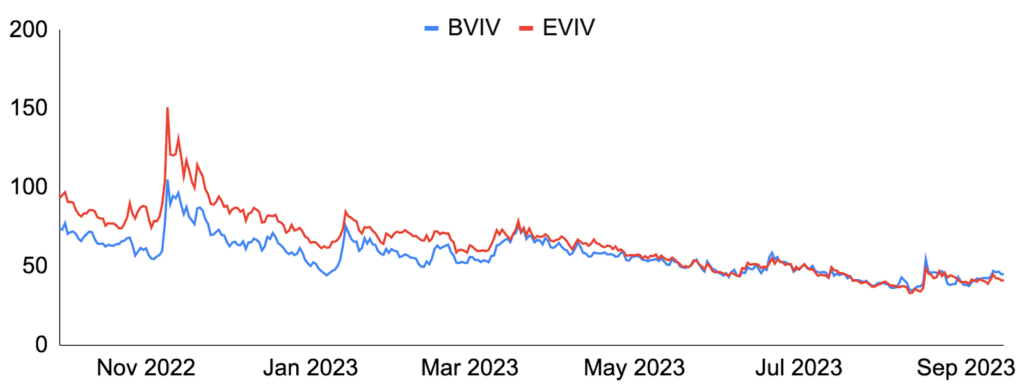
Source: Trading View, GSR.
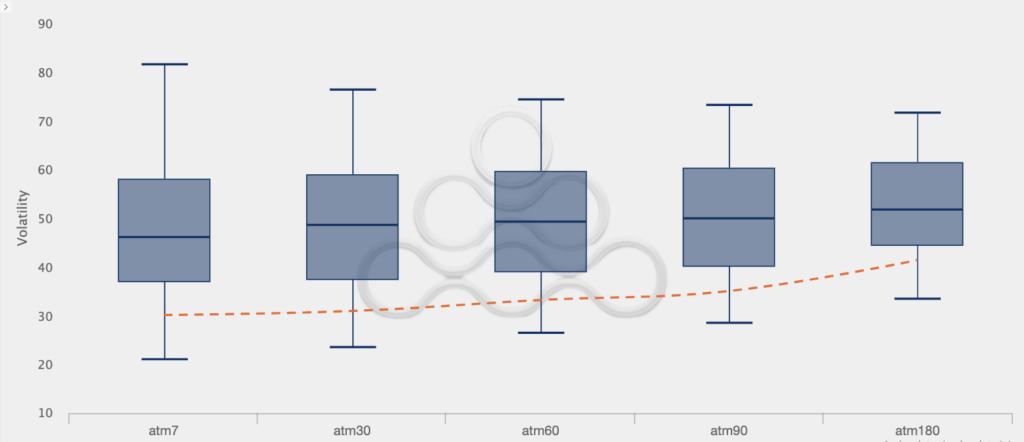
Elevated implied vols decayed fairly quickly, however, to hover around current levels, as ATM implieds across 1-week to 6-months are at the bottom of their YTD interquartile range for BTC, and well below the interquartile range for ETH (see box plots below). Despite the limited liquidity however, there was semi-persistent interest in buying upside convexity (mostly across BTC), as speculators tried to leg into call options in hopes of taking advantage of lower prices in the underlying BTC. The net taker OI on Paradigm across BTC strikes remains primarily concentrated in longer-dated 35k and 40k strikes. Following the initial interest, call skew has normalized, with 1-month 25d risk reversals pricing close to flat.
BTC ATM Volatility Boxplot
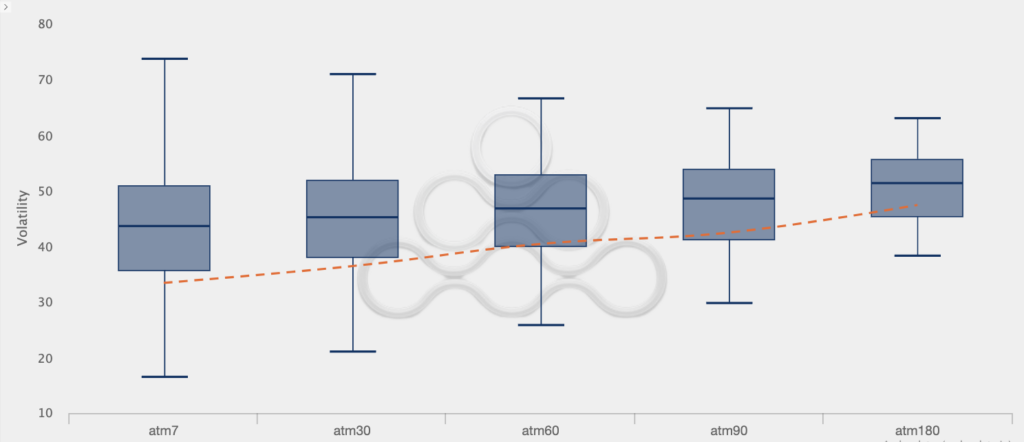
Source: Amberdata, GSR.
ETH ATM Volatility Boxplot
Source: Amberdata, GSR.
LIQUIDATIONS
Crypto prices fell suddenly on August 17th as $1b in liquidations occurred and BTC touched as low as $25,000 on Binance. With no clear catalyst, the decline was attributed to various items including a WSJ article implying Elon Musk’s SpaceX had sold its bitcoin (without any indication as to when or in what size), the shaky macro backdrop, low liquidity, and concentrated dealer gamma positioning. Since then, however, price action has been relatively range bound.
Global Perps Liquidations, $m
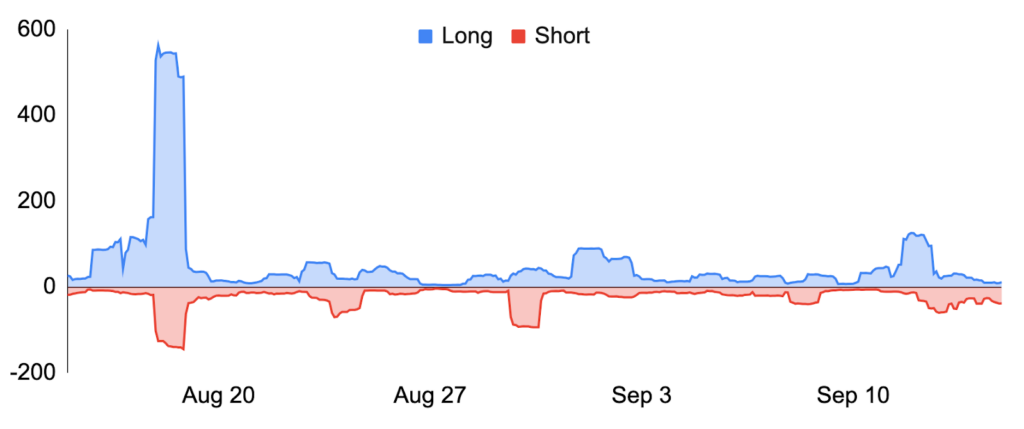
Source: Laevitas, GSR.
Projected liquidations from Coinglass for BTC are far more symmetric at these levels.
Binance BTC/USDT Liquidation Map
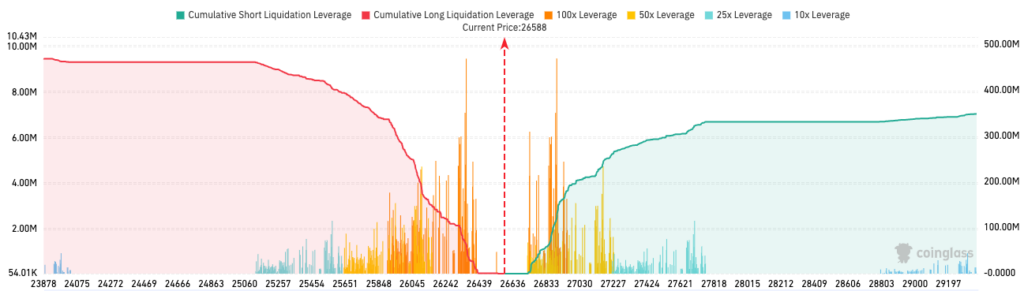
Source: Coinglass, GSR.
GRAYSCALE TRADING STRATEGIES
The market repriced the discount on Grayscale’s largest trusts, the Grayscale Bitcoin Trust (GBTC) and the Grayscale Ethereum Trust (ETHE), after Grayscale’s recent court victory over the SEC where a judge granted Grayscale’s Petition for Review and vacated the Commission’s prior denial. In the event that a spot BTC or ETH ETF were to be approved by the SEC, the price of the comparable trust would rise from today’s discounted market price and converge upward to its NAV (the mechanics of which are detailed here). As a result, the trusts provide a tradable barometer for the market-implied probability of approval when the underlying is hedged.
GBTC & ETHE Discounts
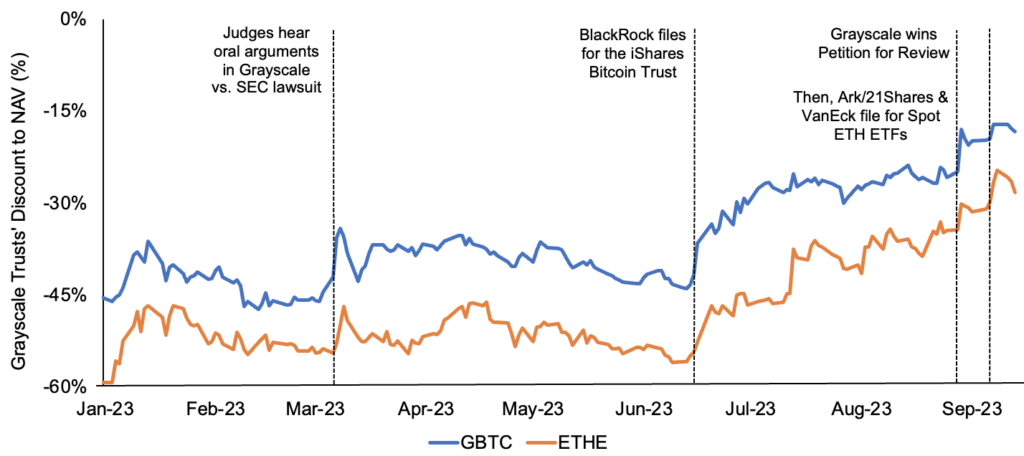
Source: Grayscale, GSR.
A common trade has been to isolate the change in the discount by hedging out the NAV of the trust’s assets using perpetual swaps. Selling a greater notional value of perpetual swaps (i.e., based on NAV instead of market price) causes traders to be net short when the discount is stable and returns on the trust equal those on the underlying, but the position fully isolates the return from the discount’s convergence without residual market exposure in the event of approval (i.e., Returns = [(1/(1-Discount) – 1) – Trust Expenses + Funding].
GBTC & ETHE Delta Neutral Returns from Convergence

Source: Grayscale, Laevitas, GSR. Note: Funding is smoothed and shows the MTD average.
While this trade has been predominantly expressed via GBTC historically, it has extended to ETHE as the SEC is now expected to approve an ETH Futures ETF next month, causing some to believe a spot ETH ETF may follow. Indeed, movements in the discount of ETHE have resembled those of GBTC, though there was a more notable convergence in ETHE’s narrowing last week after Ark 21Shares and VanEck filed for spot ETH ETFs. Lastly, expressing this trade via ETHE tends to carry worse on average as ETHE fees are higher and ETH perp funding tends to be lower, given that staking yields contribute to a flatter forward curve relative to zero-yield assets like BTC. Moreover, the timeline to a potential spot ETH ETF approval is almost certainly further away as well.
FTX ASSET SALES
On August 23, FTX and its debtors filed a motion with the US District Court for the District of Delaware seeking authorization and approval of guidelines for the sale of digital assets recovered during the bankruptcy process. Included within the motion was the selection of Galaxy Asset Management as the investment advisor, recommended management and monetization guidelines, and a stated bankruptcy court hearing date of September 13. And on September 11, FTX submitted a court filing providing updated asset balances, which include $3.4b of “category A” crypto assets comprised of SOL, BTC, ETH, APT, and others.
FTX Top 10 Digital Asset Holdings, $m
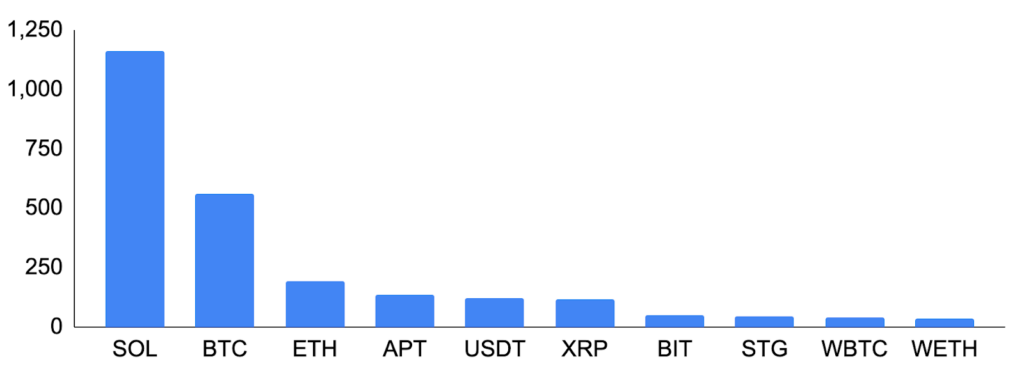
Source: Kroll, GSR. Note: $3.4b of Digital Assets A marshaled to date at August 31 pricing. The above includes all FTX.com, FTX.US, and Alameda Digital Assets A. Top 10 holdings currently represent ~72% of Digital Asset A market value.
Worries began circulating on X (formerly Twitter) around the sales on September 10th and picked up steam with the September 11th filing. This caused some assets like SOL, APT, and MATIC to fall 8-9% relative to the beginning of the month. SOL was particularly impacted, given the size of FTX’s holdings, and its perpetual swap funding rate moved significantly negative as traders bet against the coin ahead of potential sales.
SOL Funding Rate
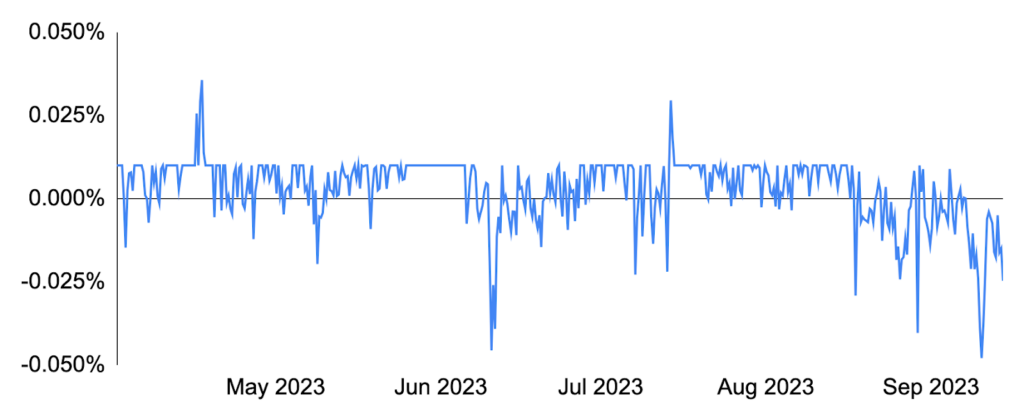
Source: Binance, GSR.
However, upon further analysis (egs. here and here), market participants began taking comfort that the weekly $100m selling limit1, unvested status of some tokens, the selling primarily via OTC rather than on-exchange means, and the removal of the advance public notice requirement in FTX’s revised plan could make the selling manageable, and most tokens at least partially recovered earlier losses. In the end, the revised selling plan was approved by a bankruptcy court on Wednesday, enabling FTX to sell, invest, and hedge digital assets starting immediately.
Month-to-date Performance of Tokens Held by FTX, Aug 31=100
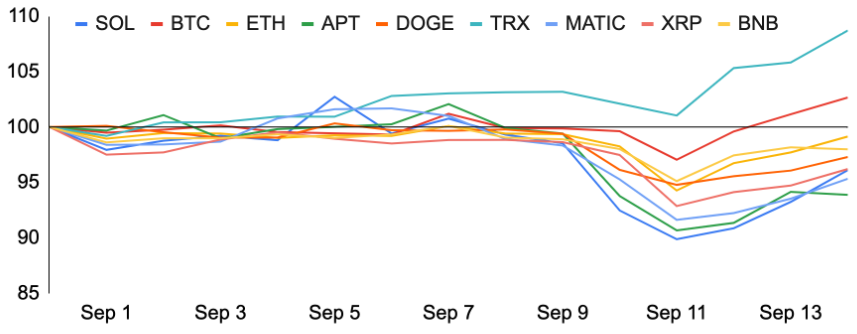
Source: Santiment, GSR.
1The weekly selling limit does not include sales of BTC, ETH, and stablecoins, and the $100m limit may be increased to $200m with approval.
Authors
GSR OTC Desk
This material is provided by GSR (the “Firm”) solely for informational purposes, is intended only for sophisticated, institutional investors and does not constitute an offer or commitment, a solicitation of an offer or commitment, or any advice or recommendation, to enter into or conclude any transaction (whether on the terms shown or otherwise), or to provide investment services in any state or country where such an offer or solicitation or provision would be illegal. The Firm is not and does not act as an advisor or fiduciary in providing this material.
This material is not a research report, and not subject to any of the independence and disclosure standards applicable to research reports prepared pursuant to FINRA or CFTC research rules. This material is not independent of the Firm’s proprietary interests, which may conflict with the interests of any counterparty of the Firm. The Firm trades instruments discussed in this material for its own account, may trade contrary to the views expressed in this material, and may have positions in other related instruments.
Information contained herein is based on sources considered to be reliable, but is not guaranteed to be accurate or complete. Any opinions or estimates expressed herein reflect a judgment made by the author(s) as of the date of publication, and are subject to change without notice. Trading and investing in digital assets involves significant risks including price volatility and illiquidity and may not be suitable for all investors. The Firm is not liable whatsoever for any direct or consequential loss arising from the use of this material. Copyright of this material belongs to GSR. Neither this material nor any copy thereof may be taken, reproduced or redistributed, directly or indirectly, without prior written permission of GSR.
